


Campbell Soup Company (NYSE: CPB) - Valuation on 23rd October 2021
The Business Model
The Campbell Soup Company (“Campbells”), founded in 1869, is an American processed food and snack company. The company is most closely associated with its flagship canned soup products. However, through mergers and acquisitions, it has grown to become one of the largest processed food companies in the U.S.
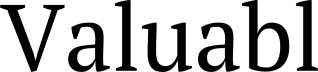
The company operates through two main segments:
Meals & Beverages: (53.5% of revenue) The retail and foodservice businesses in the United States and Canada. This segment provides Campbell’s condensed and ready-to-serve soups; Swanson broth and stocks; Pacific Foods broth, soups, and non-dairy beverages; Prego pasta sauces; Pace Mexican sauces; Campbell’s gravies, pasta, beans, and dinner sauces; Swanson canned poultry; Plum baby food and snacks; V8 juices and beverages; and Campbell’s tomato juice.
Snacks: (46.5% of revenue) This segment retails Pepperidge Farm cookies, crackers, fresh bakery, and frozen products; Milano cookies and Goldfish crackers; and Snyder’s of Hanover pretzels, Lance sandwich crackers, Cape Cod and Kettle Brand potato chips, Late July Snacks, Snack Factory Pretzel Crisps, Pop Secret popcorn, Emerald nuts, and other snacking products. This segment is also involved in the retail business in Latin America.

Campbells sells its products through retail food chains, mass discounters and merchandisers, club stores, convenience stores, drug stores, dollar stores, e-commerce and other retail, commercial, and non-commercial establishments, and independent contractors and distributors.
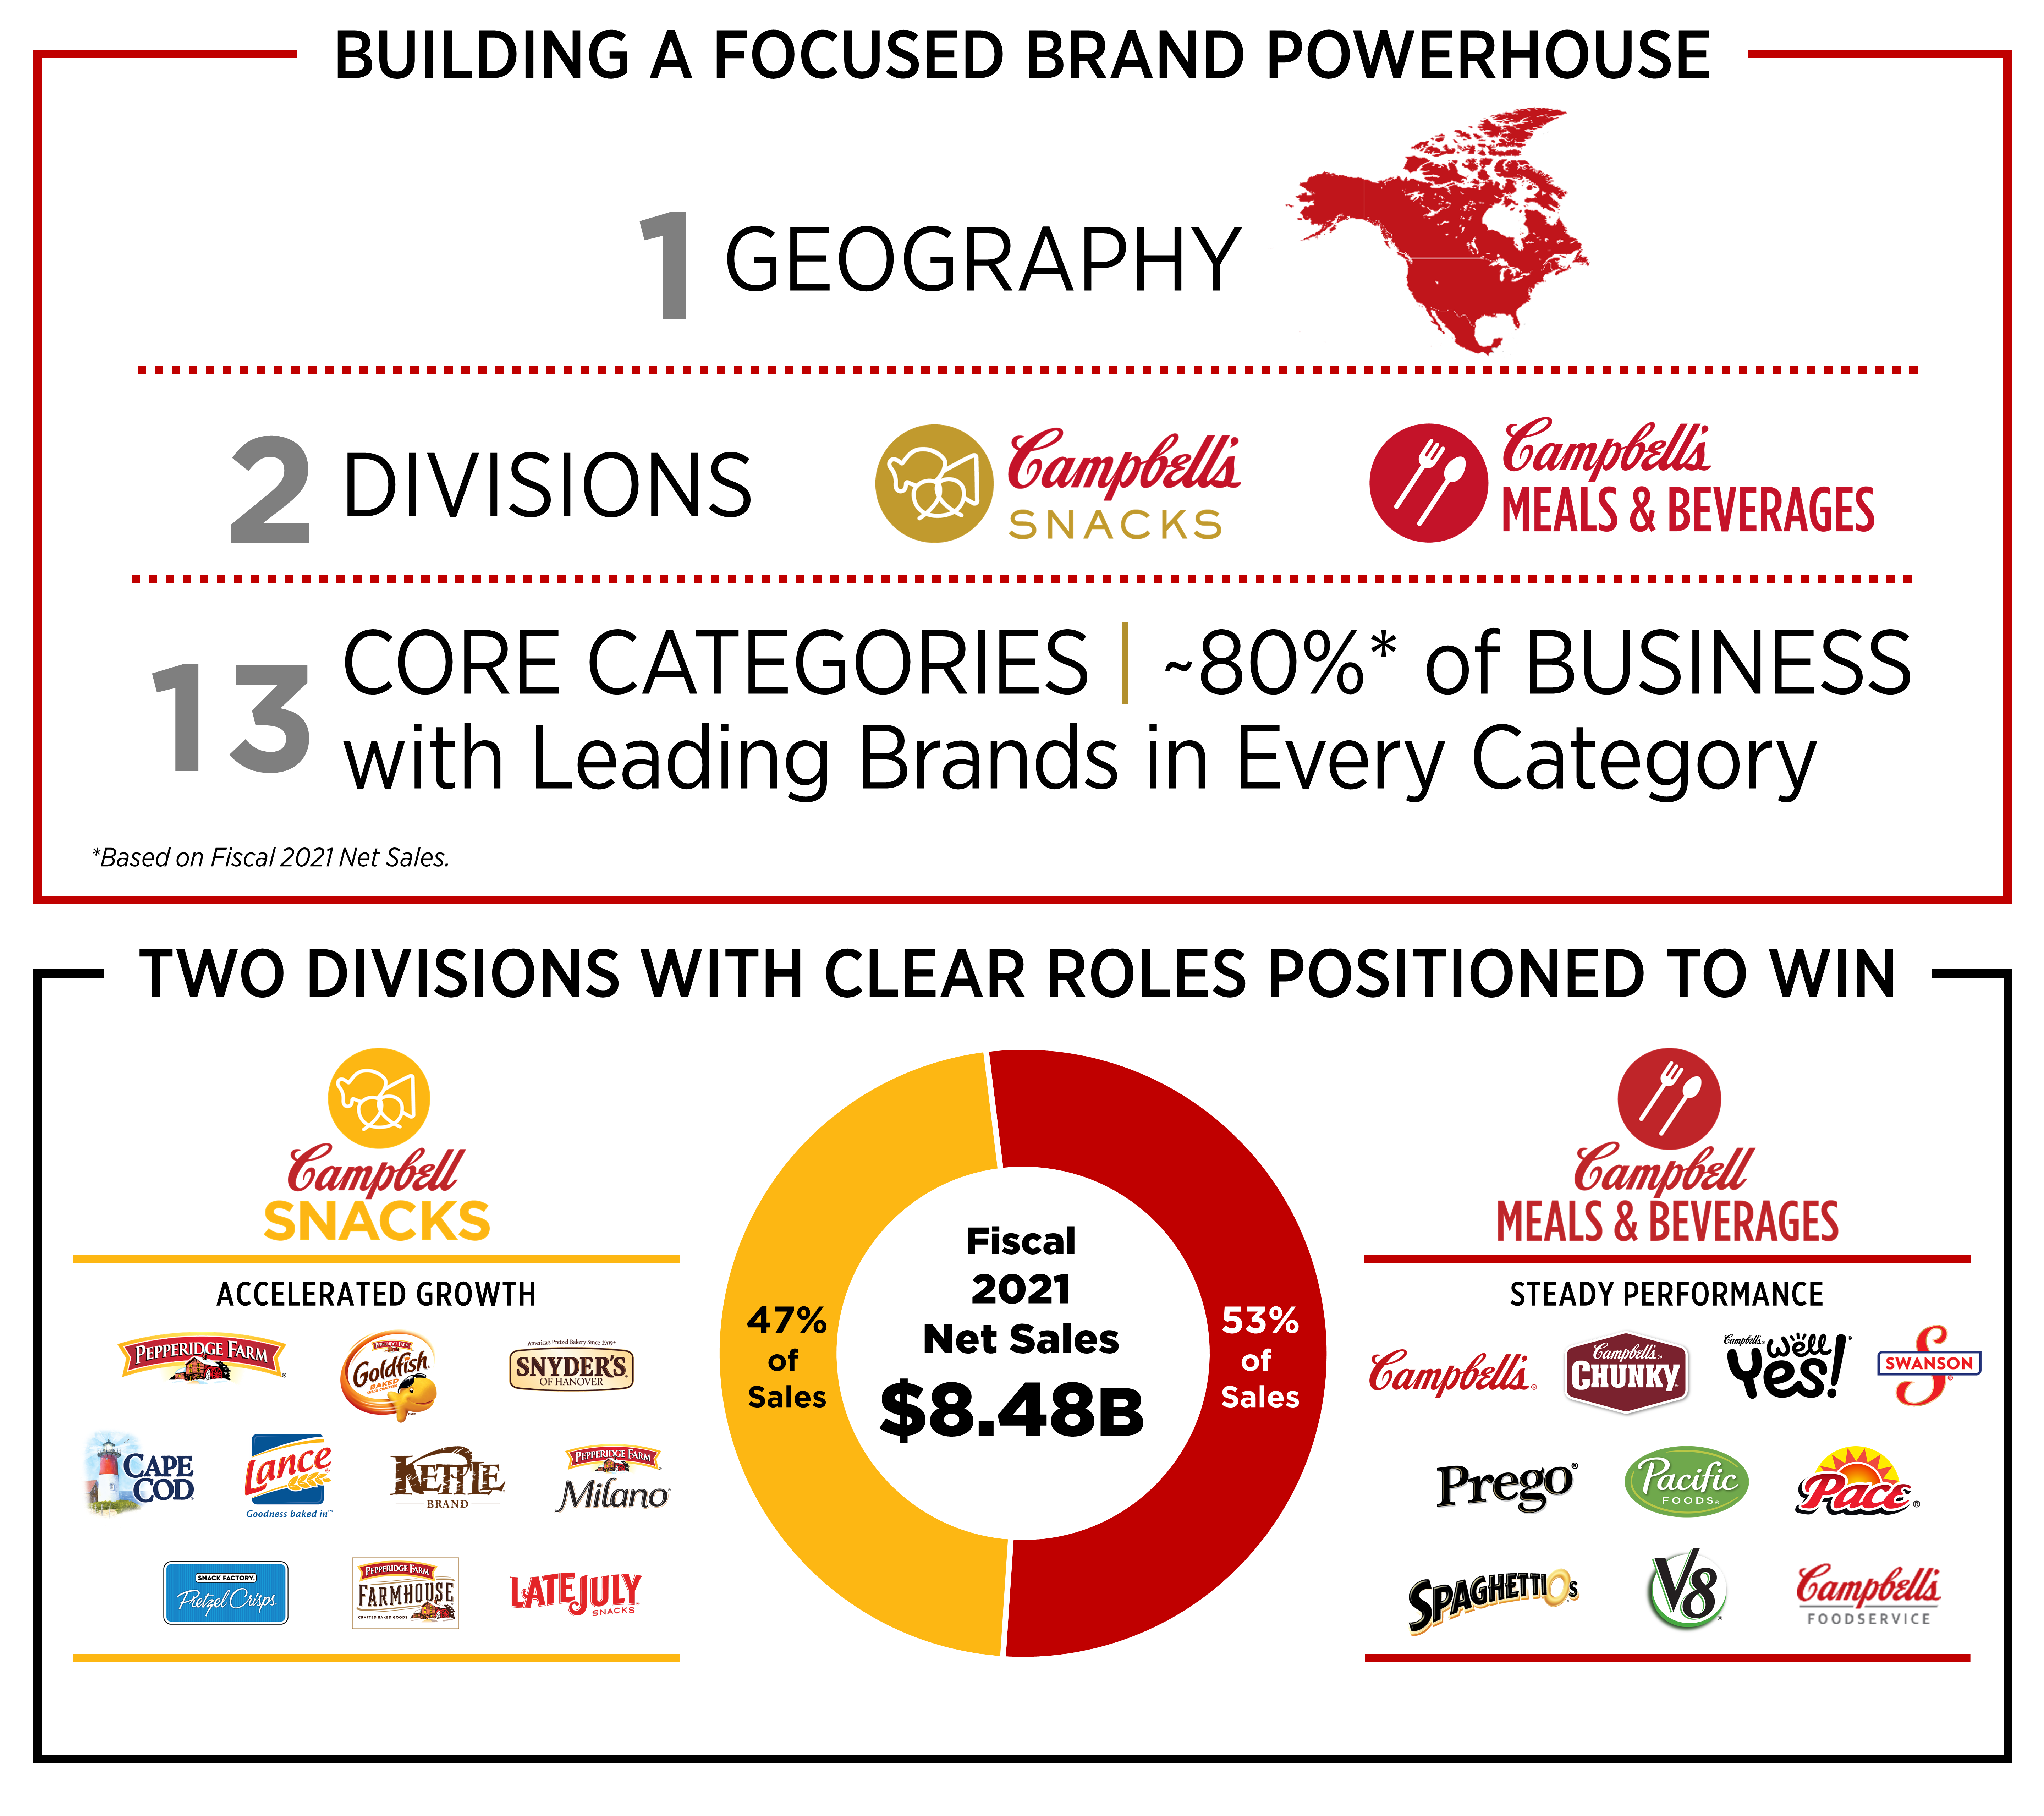
Despite being most known for its soups, the company’s biggest selling product category is Snacks. Campbells gets 47% of its revenue from Snacks, 30% from Soups, 13% from Other Meals, and 9% from Beverages.
Finally, the company generates the bulk (94%) of its revenue in the U.S., with only 6% of revenue coming from overseas markets.

The History
In 1869, Joseph Campbell, a wholesale fruit and vegetable vendor, and Abraham Anderson, a commercial canner and packer, formed Anderson & Campbell in Camden, New Jersey. This partnership would eventually become the Campbell Soup Company.
1894: Arthur Dorrance succeeded Joseph Campbell as President.
1895: The first jar of ready-to-eat soup, Beefsteak Tomato, was introduced.
1897: Dr. John T. Dorrance, Arthur’s nephew, invented condensing soup, leading to smaller packaging: Cans.
1914: Dr. John T. Dorrance became President of the company.
1931: Began radio advertising with iconic “M’m! M’m! Good!” jingle.
1934: Introduced Campbell’s Chicken Noodle soup.
1941: Opened Campbell Test Kitchen with professionally trained home economists developing recipes.
1948: Acquired V8, the leading vegetable juice in the U.S.
1951: First T.V. commercial premiered.
1954: Went public on the New York Stock Exchange with the ticker CPB.
1961: Acquired Pepperidge Farm, a baked goods company.
1962: Andy Warhol debuted the iconic Campbell’s Soup Cans paintings at the Ferus Art Gallery in Los Angeles.
1965: SpaghettiOs debuted.
1970: Launched Chunky soup.
1981: Launched Prego pasta sauces which became the #1 new dry grocery product of the ’80s.
1995: Acquired Pace Foods, a leading producer of salsa.
2016: Launched ‘Well Yes!’ Range of soups.
2017: Acquired Pacific Foods, a manufacturer of organic broths, soups and plant-based beverages.
2018: Acquired Snyder’s-Lance, Inc., a leading snack company with well-known brands like Kettle Brand.
The Financials
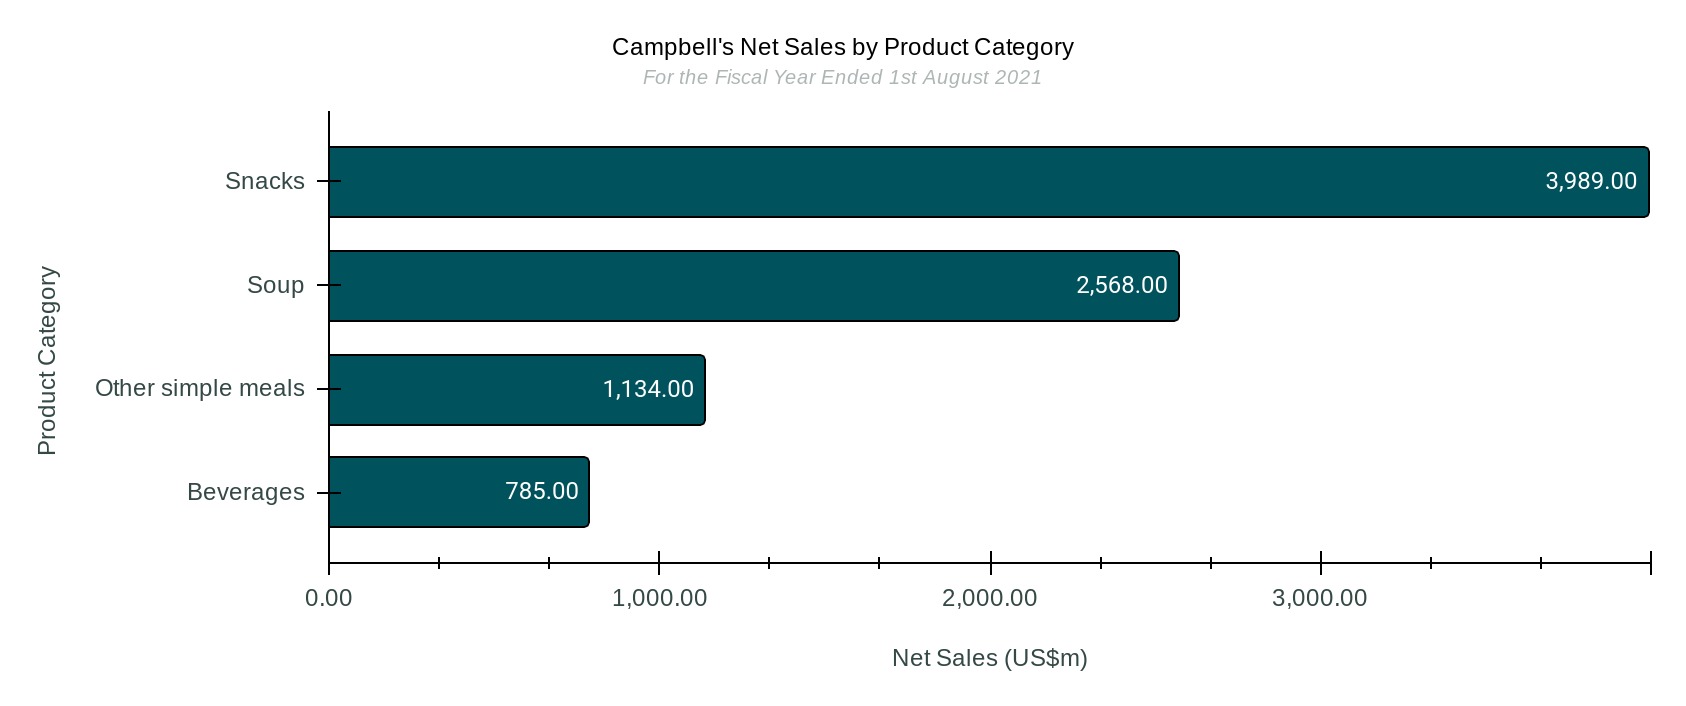
Investors in the Campbell Soup Company have had a tough five years. Not only are the shares down from their 2016 peak, but they have dramatically underperformed the S&P500 in that time.
Moreover, since 2012, the S&P500 has given investors a total return of 274%, while the Campbell Soup Company has only returned 64%. Interestingly, as the following chart illustrates, the company’s returns were broadly in line with the market’s returns until mid-2017. But, since then, they have diverged dramatically. The market has not liked the Pacific Foods (2017) and Snyder’s-Lance (2018) acquisitions.
In addition, the COVID-19s effect on the company’s returns was muted compared to the impact on the broader market. We can see that in early 2020 when governments first enforced lockdowns and financial markets were at peak fear, the S&P500 collapsed while CPB held up. Since then, however, the market has rallied while Campbells has lagged.
Looking at the underlying financials themselves, we can begin to paint a picture of a company producing consistent and steady operating profits but is not growing.
From the following chart, we can see that in 1994, Campbell’s turned over about US$6.8b and that by 2019 this number had barely grown. However, by the TTM to1st August 2021, revenues were up modestly to US$8.4b.
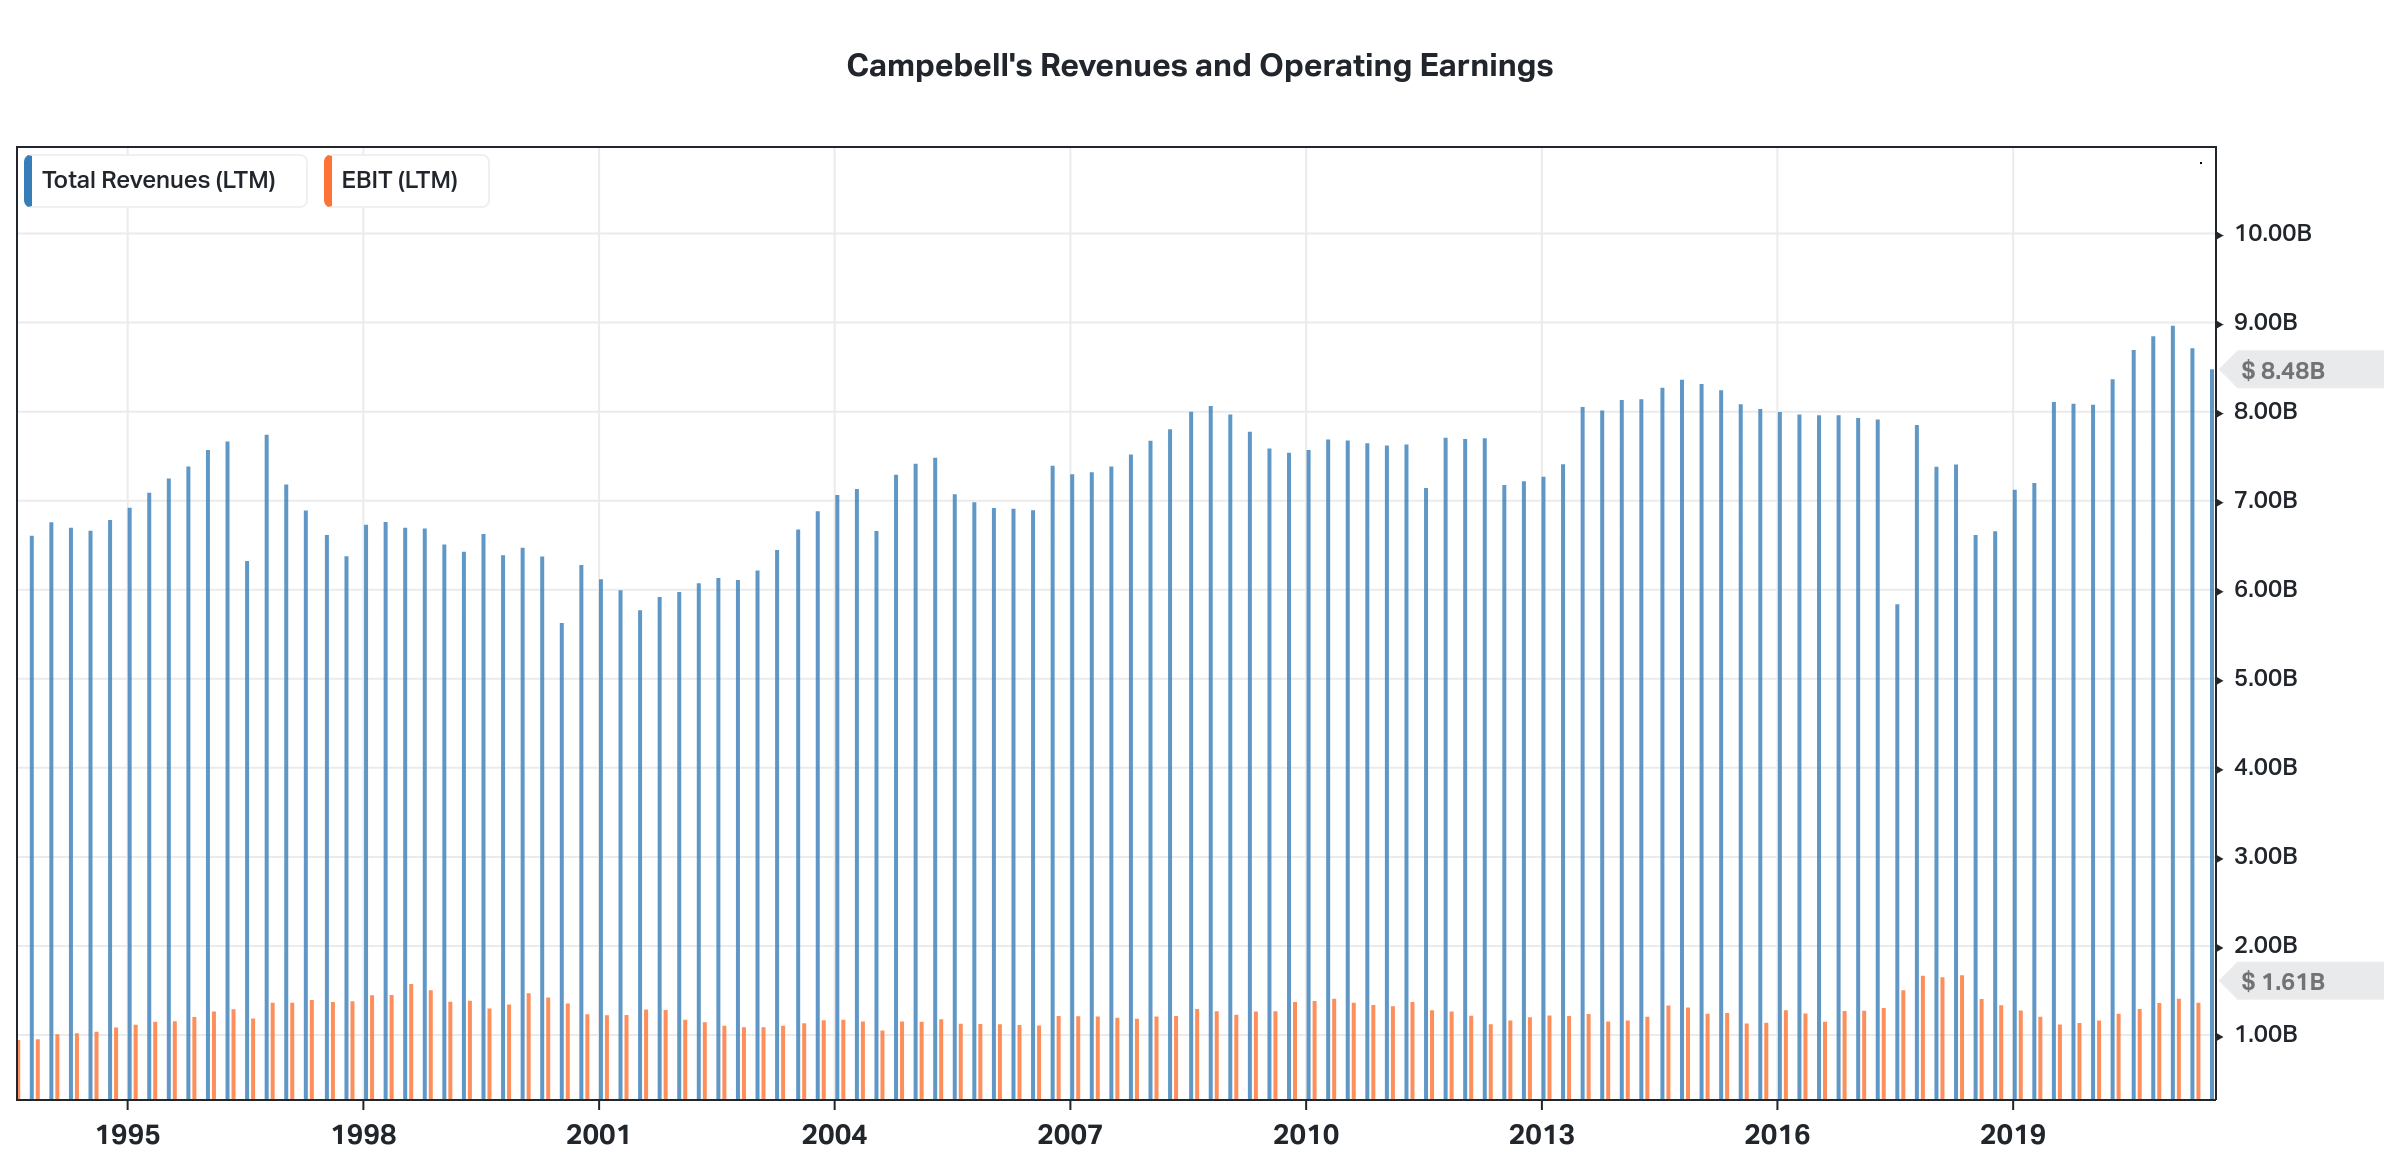
We can also see from this chart how consistent operating earnings (EBIT) have been. The business hasn’t grown, but this is a company whose profits have mainly been recession-proof. Neither the recession of the early 2000s, the Great Recession, nor the COVID-19 recession put a meaningful dent in the company’s operating profits. The Campbell Soup Company has a robust business model.
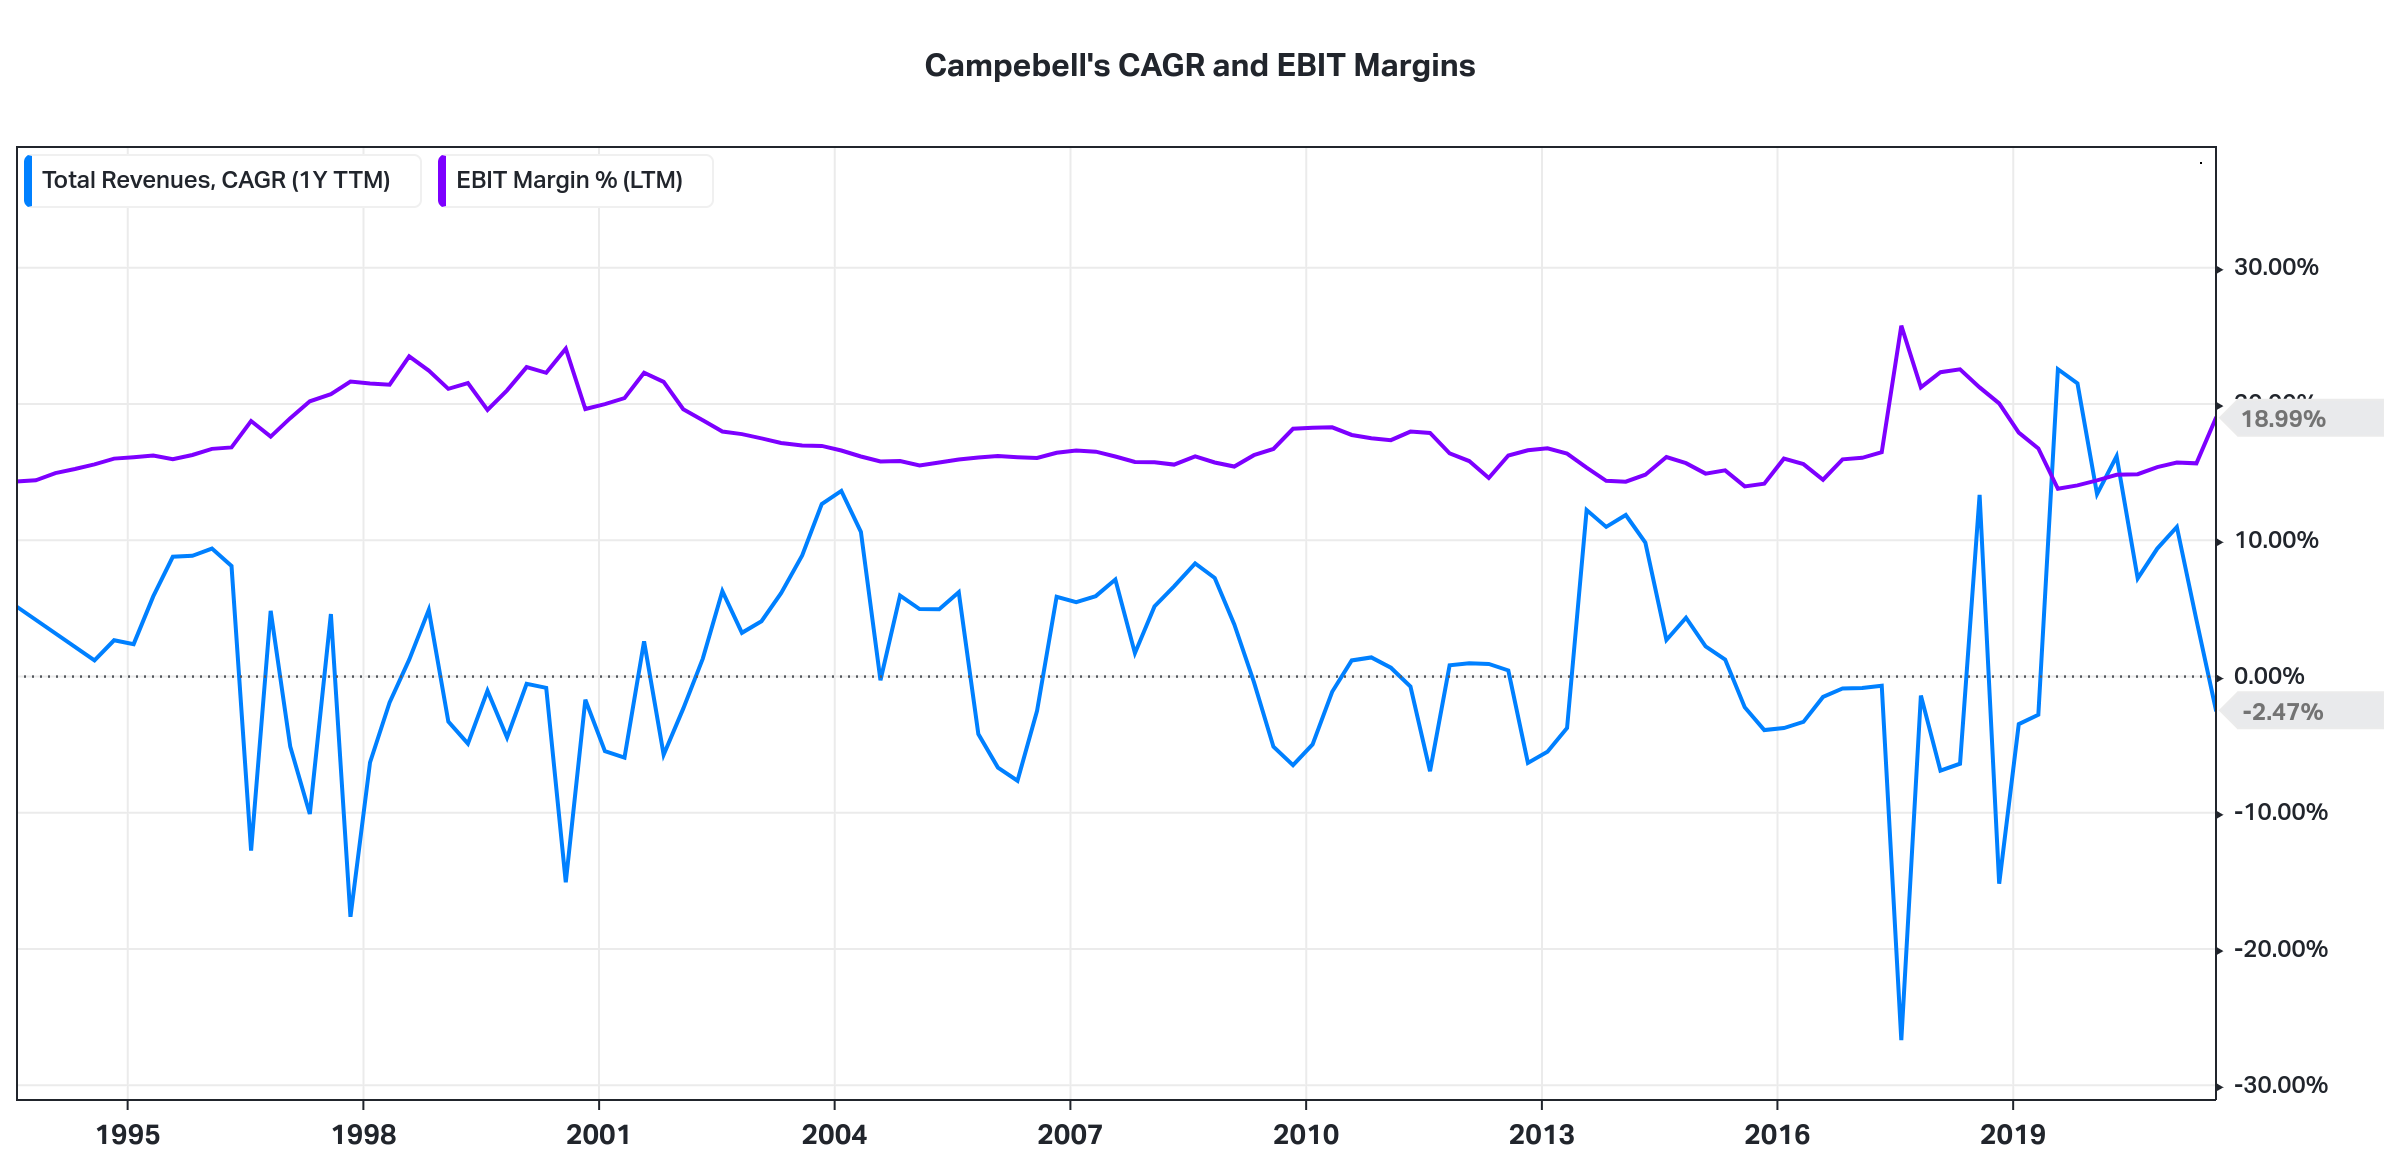
The following chart further illustrates how steady this business is. Since the mid-1990s, margins have fluctuated between 13% and 24% but have never deviated outside this range. The company’s margins peaked in the late ’90s and have, except for a spike in 2017, averaged 17% since 2005.
Despite the Campbells Soup Company’s revenues barely growing over the last 25 years, the company has retained and reinvested a substantial amount of additional capital. And, as a result, the returns on that capital have dwindled.
In 1995, there was about US$3.3b of capital invested in the business and that capital was earning about 21%. Fast forward through the acquisitions over the following 25 years, and Campbells now has about US$8.45b worth of capital invested in it.
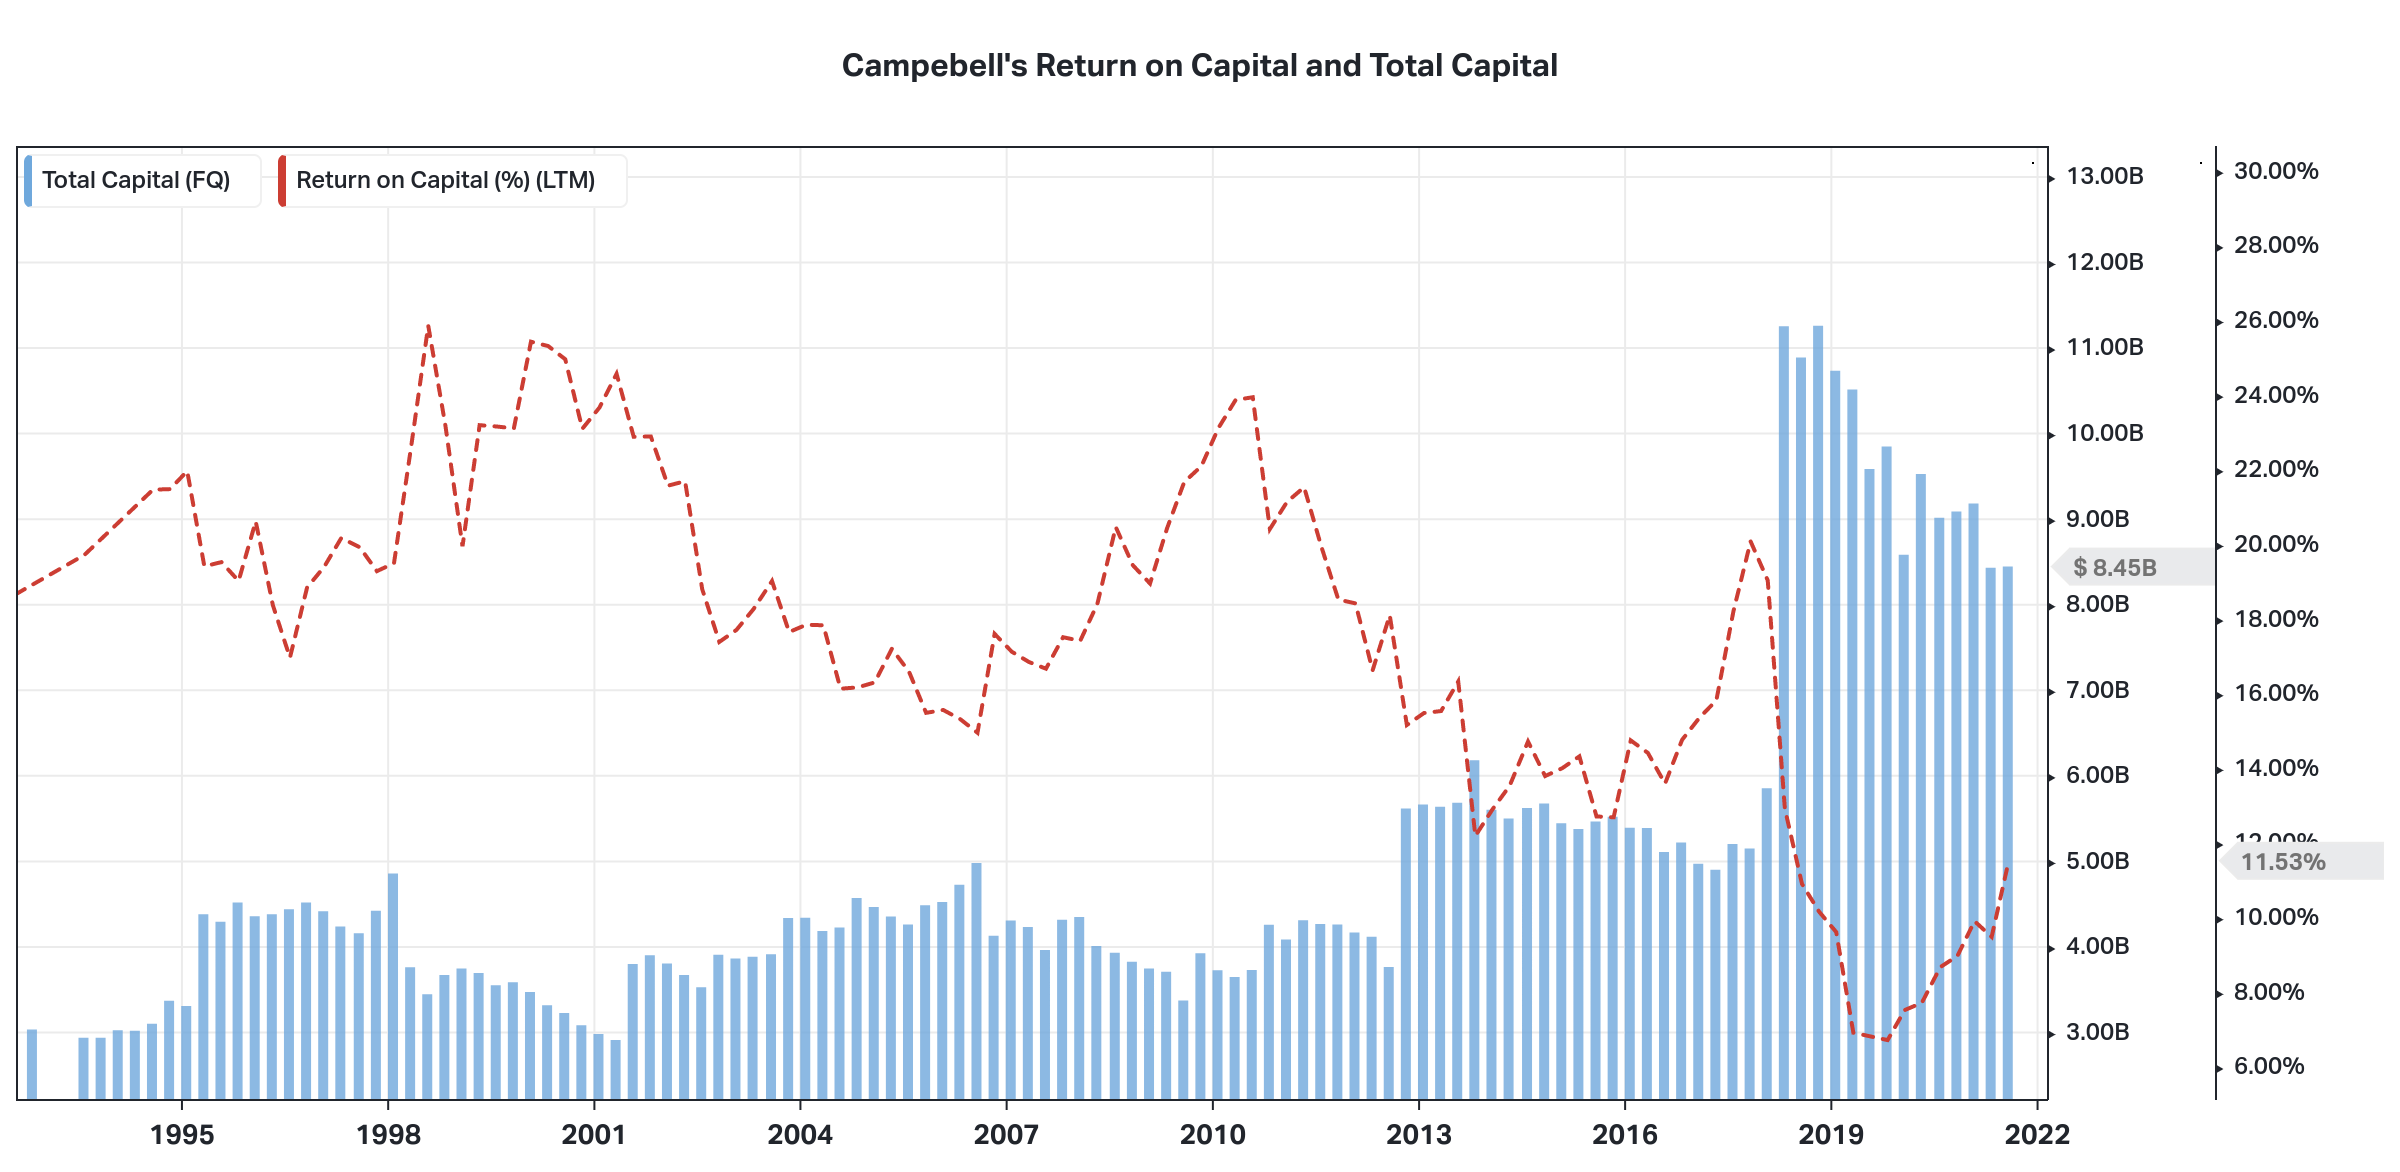
However, as the earnings are roughly the same, the return on this capital has dwindled to about 11.5%. This is still above the businesses cost of capital, but it demonstrates the company’s failure to incorporate the acquired businesses in a revenue/earning accretive way.
Finally, Campbell’s EBIT Margins have been going backwards relative to other Food Products businesses. From the following chart we can see that in 2009/10, Campbell’s margins were at the top of this group of companies. However, as Campbell’s margins have gone sideways, other food products businesses have increased their margins, leaving Campbells a laggard.
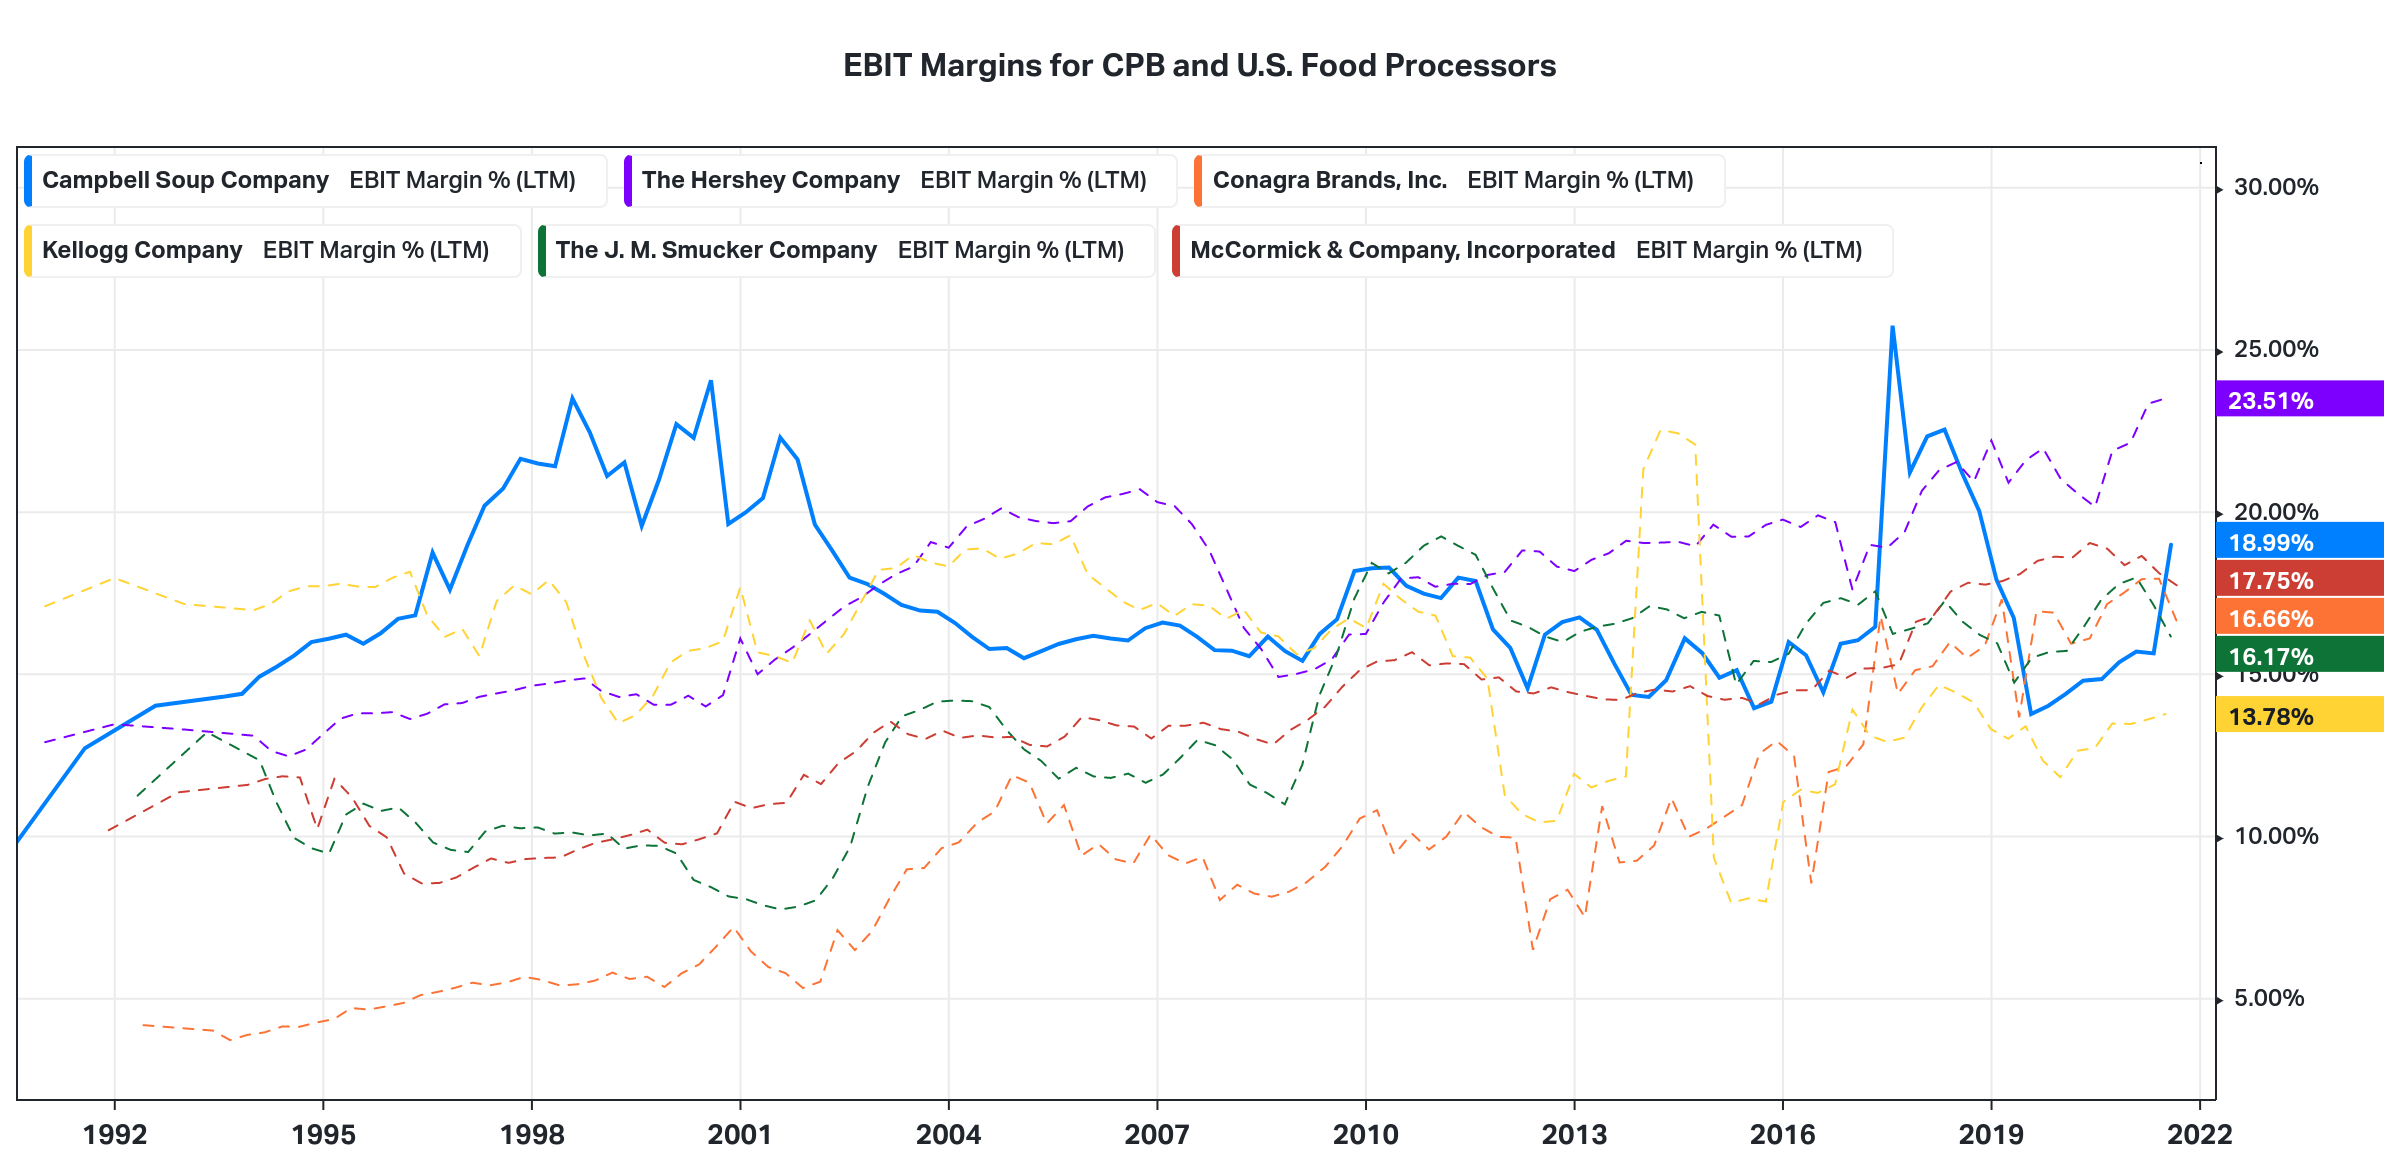
But, despite this, the company’s margins are still above the average (13.99%) of all Food Products businesses in the U.S.
The Story
The Campbell Soup Company (US$12.3 billion market cap) is an iconic American processed food and snack business. The soup and convenience meal markets are shrinking (-2.7% and -1.4% CAGR), but the recent Snyder’s-Lance acquisition gives them a strong position in the steady snack market (+0.09% CAGR). The company will struggle against societal shifts towards healthy and artisanal products, but their valuable branding will help them maintain market share (4.9%) while they update their product portfolio. Inflationary pressures will weigh on margins as they struggle to pass through increased costs and will be pushed towards the lower-end (16%) of their long-term range (16-18%). However, this is a well-capitalised business (31% D/EV) producing generous FCF (US$1.14 billion FY’22).
Total Market: Campbells operates in four different product markets: Snacks, Soups, Other Simple Meals, and Beverages. In the U.S., economists expect the Soup and Simple Meals markets to shrink over the next five years at a -2.7% and -1.4% CAGR, respectively. However, they expect the Non-Alcoholic Beverage market to grow at a 4.4% CAGR and the Snack market to remain steady.
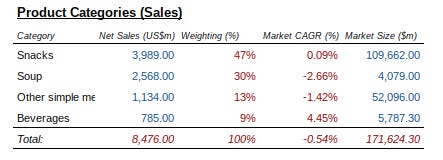
As a result, the weighted-average compound annual growth rate for Campbell’s markets is -0.54%.
x Market Share: Campbell’s currently captures 4.9% of the net sales for the markets it operates in, but this market share is likely to come under pressure as consumers continue to shift towards healthy and artisanal products. However, the company has leading brands across all of its categories, and this brand value and consumer pull doesn’t disappear overnight and will help them maintain their market share.
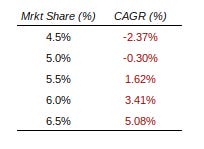
= Revenues: Based on this, I forecast Campbell’s to grow revenues at a -0.3% CAGR over the next five years. Moreover, I am assuming that they will find a way to update their portfolio of products for these societal shifts and that the business will grow at the risk-free rate in the stable phase.
For comparison, this revenue growth assumption is more bearish than the analysts’ consensus of -0.02% CAGR from the 15 analysts covering CPB and much more bearish than its fundamental growth rate (8.8%) as I have calculated it.
x Margins: Ongoing inflationary pressures in the supply chain will constrain margins over the medium term. The company will try to pass these through with higher prices, but I suspect that the price elasticity of demand for their products is less than they think. As a result, this pricing and margin pressure will push margins down towards the lower end of their long-term range. However, Campbell’s has the benefit of enormous scale, which drives an operational cost advantage. Their operating leverage ratio (0.2x) is less than the industry average (0.25x), and this will help keep margins above the industry average (14%).
I have projected margins to converge at 16.0%.
- Taxes: I have forecast for the company’s tax rate to trend from its current effective rate (24.6%) to my estimate of its underlying marginal corporate rate (26.9%) over the next ten years.
- Reinvestment: Campbells is a large, capital intensive business - especially following the 2017 and 2018 acquisitions. Furthermore, as the company relies heavily on branding, I have capitalised the marketing spend. As a result, the business currently produces 82 cents in revenue for every dollar of invested capital. I have forecast for this capital efficiency ratio to be maintained.
= Free Cash Flows: Based on the above, I expect the business to remain FCF generative and not need to raise any capital. Moreover, I hope that they will continue using excess cash to repurchase shares as they have been doing for the past few years.
Adjust For: Time Value & Risk: The Campbell Soup Company is a Food Products (91%) and Non-Alcoholic Beverage (9%) business getting 94% of revenue from the U.S. and 4% from International markets. It has less operating leverage (0.2x) than the industry (0.25x) but has a substantial amount (31% Debt/Enterprise Value) of financial leverage. Moody’s has assigned CPB a Baa2/BBB credit rating. The implied chance of distress for this rating is 3.23%.
My estimate for the company’s WACC is 4.62%.
+ Non-Operating Assets: The company has US$69m in cash and equivalents.
- Debts & Other Claims: Finally, the business owes US$5.5b in debts and leases; there is US$6.2m worth of non-controlling interests and 1.37m employee options outstanding that I have valued at $7.09m.
The Valuation and Rating
I have valued the business in USD.
The Campbell Soup Company share price is currently around the 18th percentile on my Monte Carlo simulation distribution of values. Based on my valuation model, the shares are worth more than the current price in 82% of scenarios and less in 18% of scenarios.
I am adding these shares to my portfolio.