


Vol. 2, No. 9
On the cost of capital. Regional equity valuations. The Fed is going to tank the housing market. Corporate shuffleboard. Credit creation, cause & effects. Value in generic pharmaceuticals.
Valuabl is an independent, value-oriented journal of financial markets. Delivered fortnightly, Valuabl helps contrarians pop bubbles, buy low, and sell high.
In today’s issue
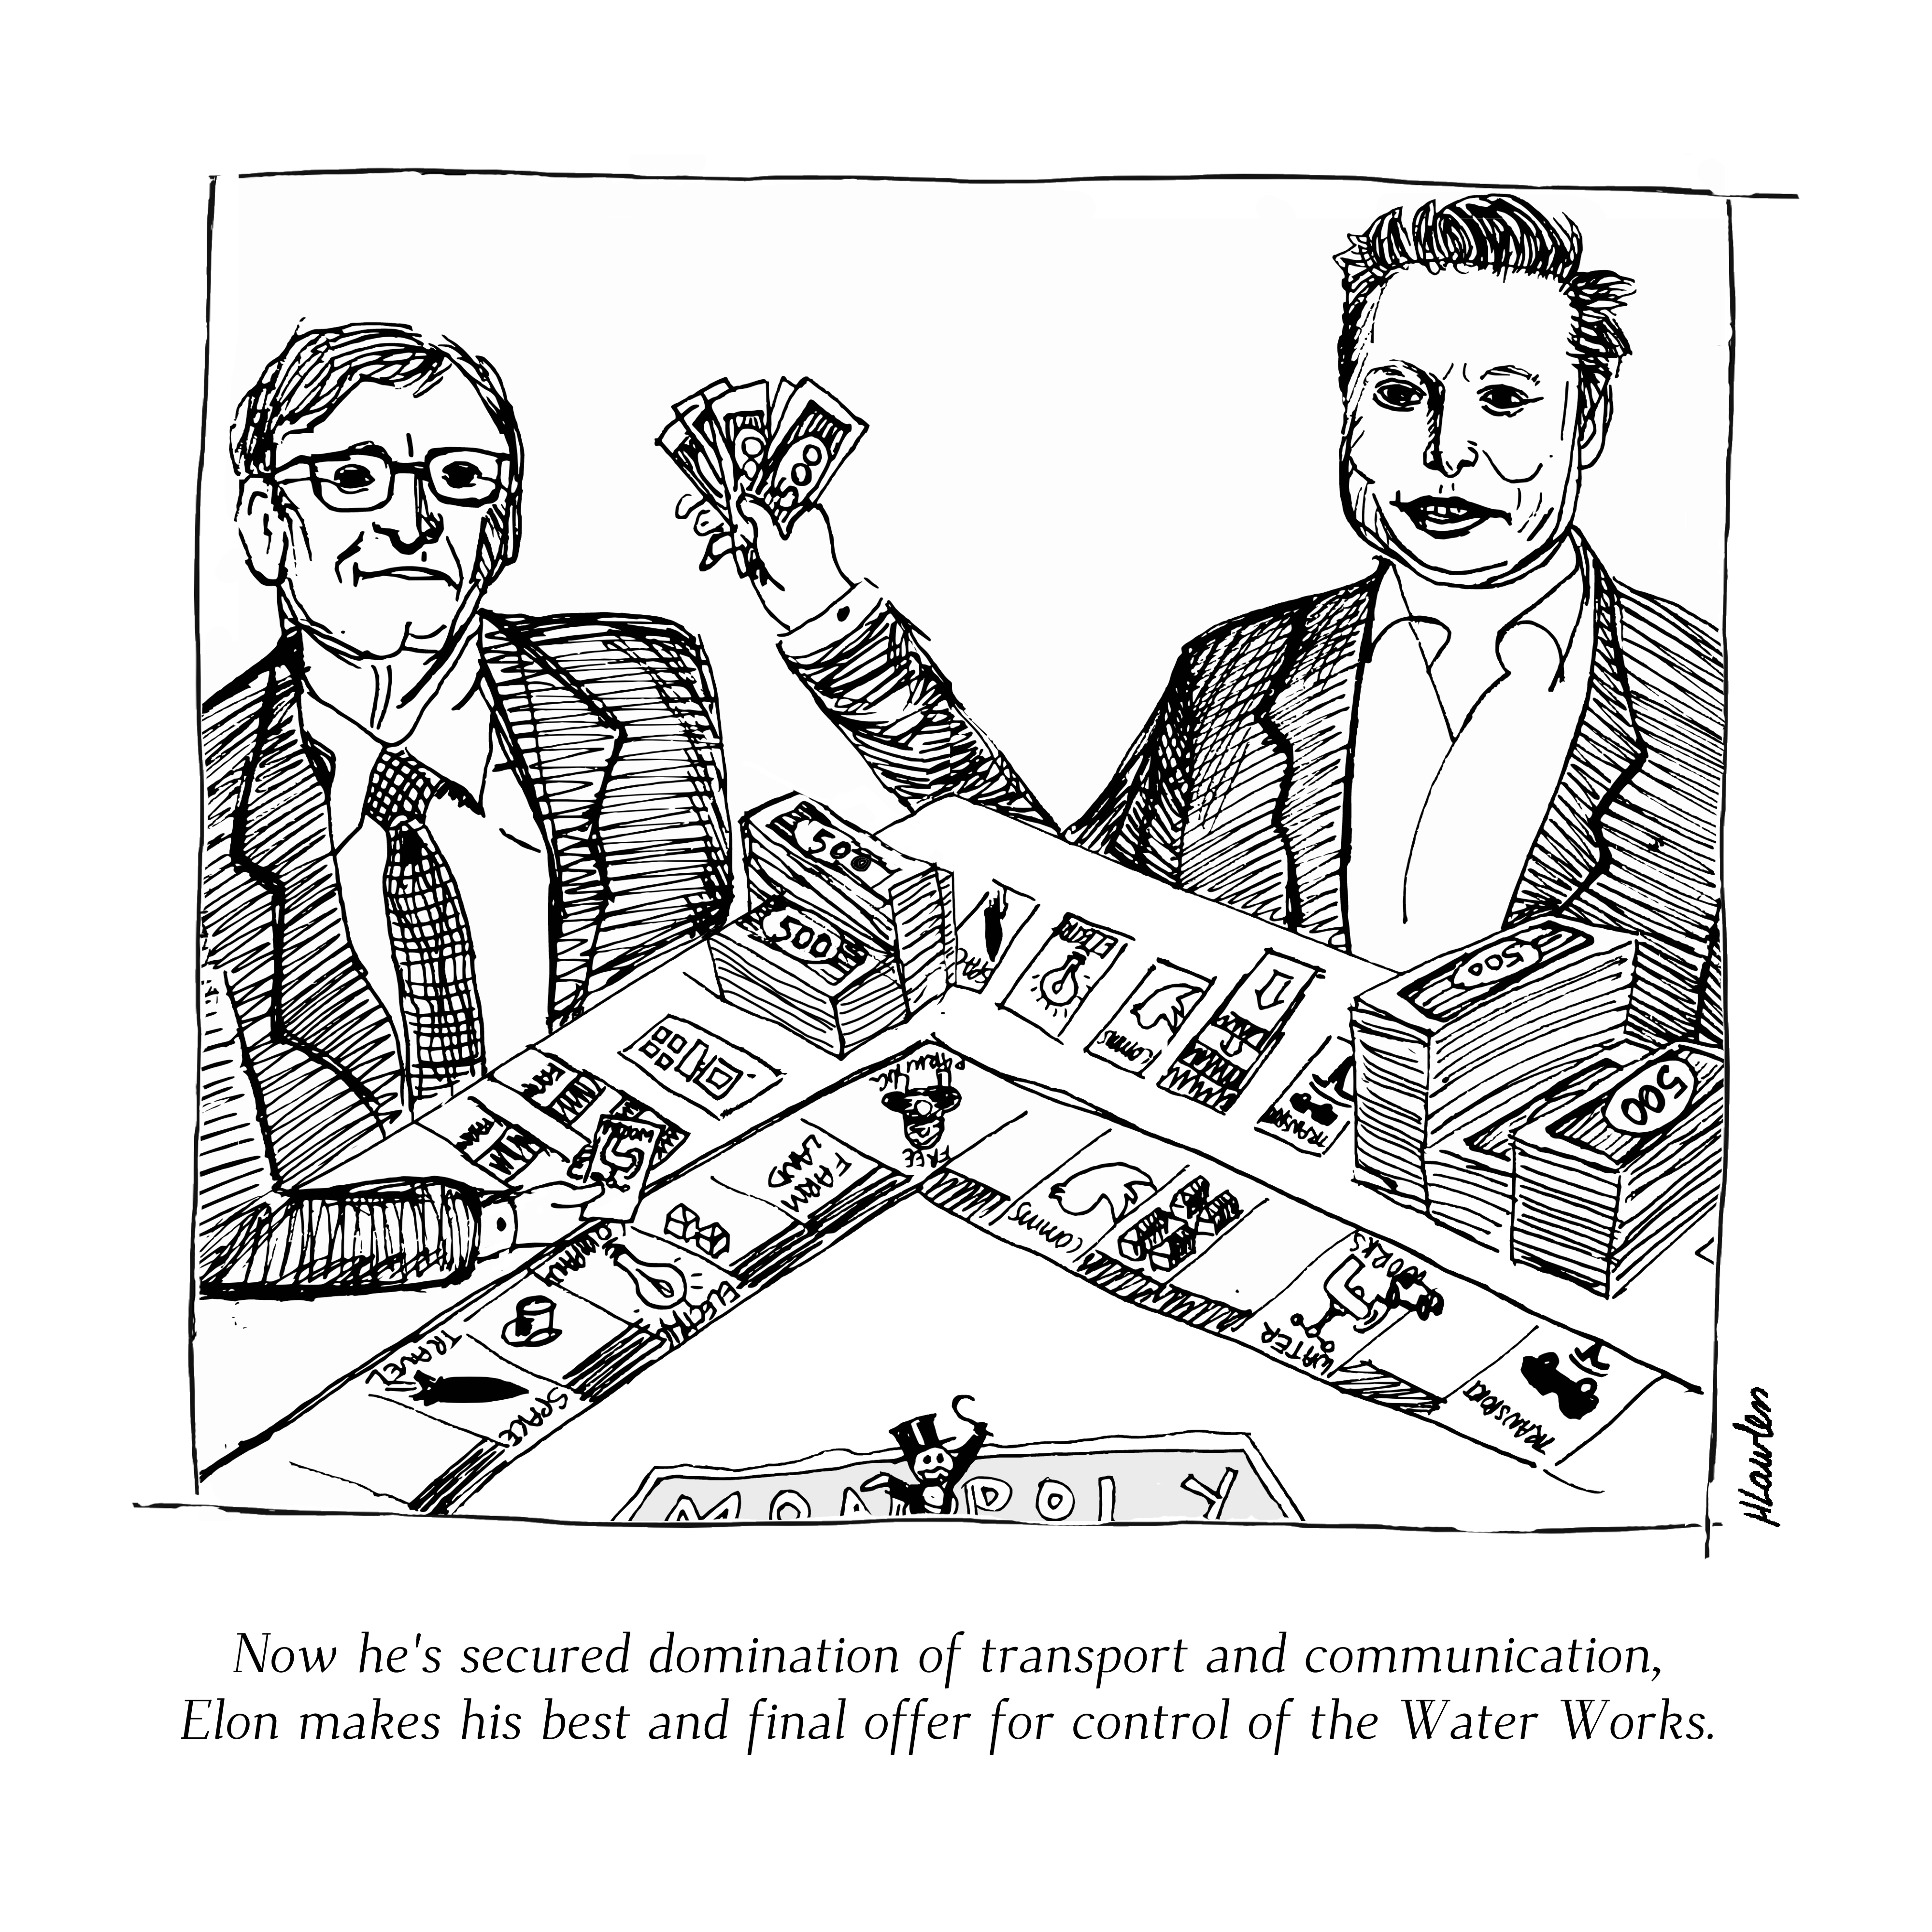
Cartoon: Billionaires’ game night
The cost of capital (4 minutes)
A global stocktake (4 minutes)
As safe as houses (7 minutes)
Corporate shuffleboard (4 minutes)
Credit creation, cause & effects (5 minutes)
Investment ideas (16 minutes)
Cartoon: Billionaires’ game night
The cost of capital
Interest rates and capital costs are the most consequential yet misunderstood prices in capitalism, connecting the future to the present.
•••
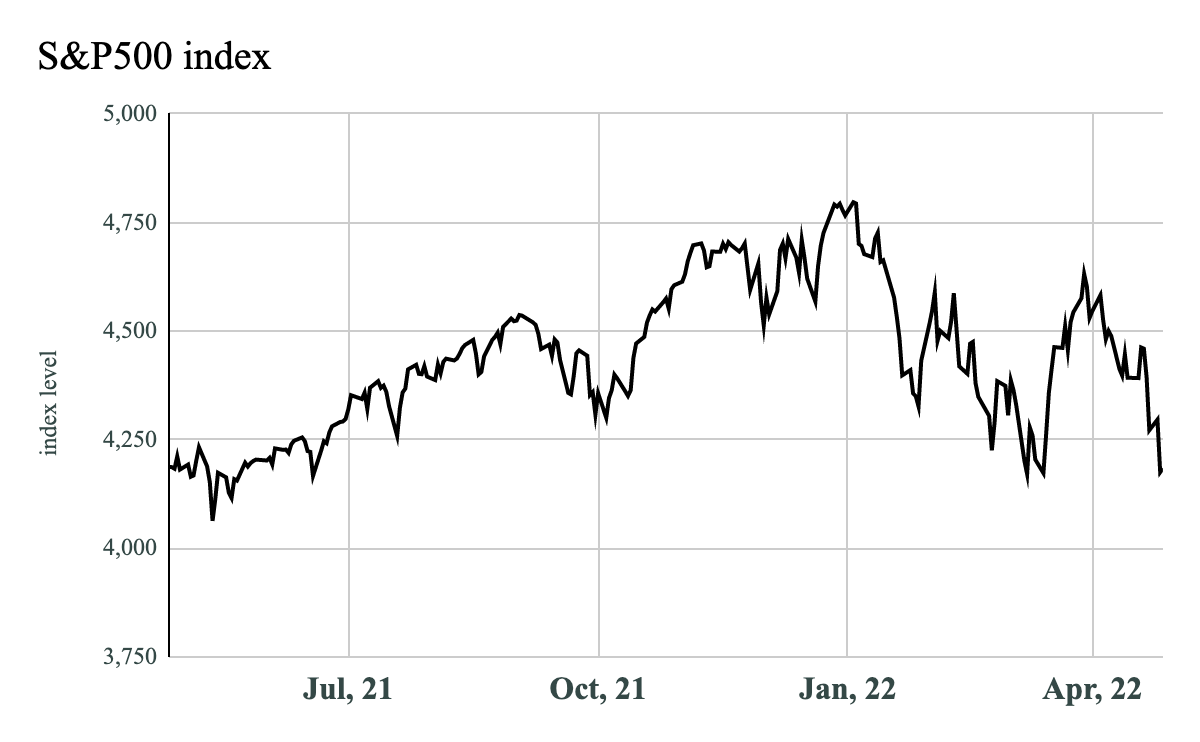
U.S. stock prices fell again last fortnight. The S&P500, an index of large U.S. companies, was down 6.0% to 4,180. The index is now down 12.3% from the start of the year, testing its previous March lows, and is now flat over the last 12-months.
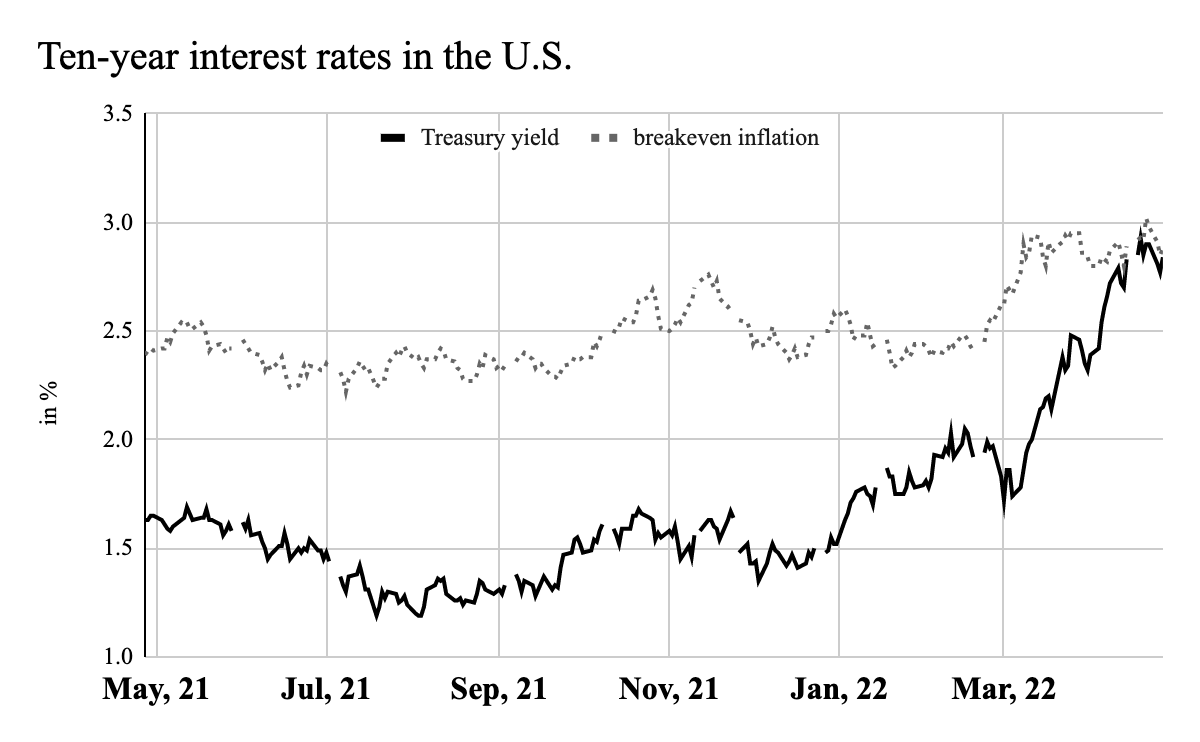
The price of 10-year U.S. Treasury notes dropped again as yields rose. Yields peaked at 2.93% on April 19, their highest point since 2018, before falling to 2.84%, seven basis points (bp) higher than last fortnight. While Treasury yields were climbing, the 10-year breakeven inflation rate rose slightly to 2.88%. These are still historically high levels of expected inflation and about the highest levels since the Federal Reserve began reporting this data in 2003. Investors are now losing just 0.04% of their purchasing power per year by investing in Treasuries. We are almost back into positive real rate territory for the first time since the COVID-19 crisis began. Is financial normality knocking on the door?
The equity risk premium (ERP), an estimate of the extra return investors demand for investing in stocks over government bonds, rose by 25bp. The current ERP, 5.21%, is still down from its recent high of 5.29% in March, when investor fear was multiplying, but remains much higher than it has been historically. The cost of equity, and the implied return for U.S. stocks, have also increased to 8.04%. While U.S. dollar risk-free rates are still historically low, in the 19th percentile of data going back to 1960, equity risk premiums are far above average, in the 80th percentile. Equity investors are again becoming increasingly fearful.

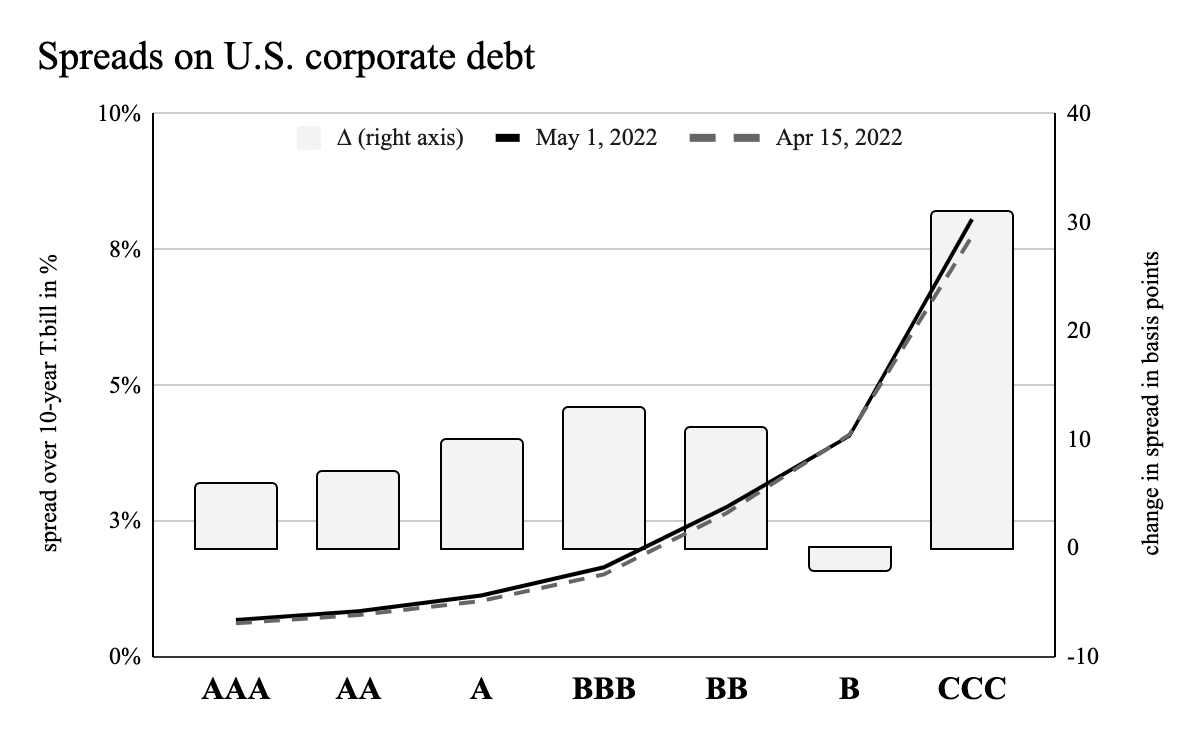
Spreads on U.S. corporate debt rose, too. The average spread of corporate bonds over 10-year Treasury bonds rose by 11bp. Spreads at the riskier end of the curve rose more than the safe end, except those rated ‘B’. In most monetary and credit contraction cycles, creditors likely believe rising interest rates will stress uncreditworthy borrowers and defaults will rise.
There are some signs that rising rates and expanding spreads are already affecting debt financing. A note from the Wall Street Journal detailed how Carvana Co. (NYSE: CVNA), “once a market darling,” failed to get away a $2.3bn junk bond issuance at a 10.5% yield. That is until Apollo Global Management, Inc. (NYSE: APO), an investment firm already invested in Carvana’s equity and debt, stepped in to restructure the offering and buy $1.6bn worth of the bonds at a 10.25% yield. Moody’s Investors Service downgraded Carvana’s long-term bond rating from B3, already highly speculative, to Caa1, in line with the issuance.
Using the average ERP of the last five years, the current 10-year T.bill yield, analysts’ consensus earnings estimates, and a stable payout ratio based on the S&P500’s average return on equity over the last decade, I value the index at 4,205 compared to its level of 4,180.

This valuation suggests the S&P500 index is now 0.6% undervalued compared to 8% overvalued at the start of the year and 27% 12-months ago.

READY FOR MORE?
This is the end of the free portion of Valuabl. To access all issues and support independent research, consider becoming a paid subscriber.