


Vol. 3, No. 4 — Interest rate holes in the hull
Can higher interest rates cause higher inflation? Stocks look like fair value. Deficit spending and bank lending has supported America's economy. Value in Australian retail.
Welcome to Valuabl, a twice-monthly digital newsletter providing value-oriented financial market analysis and investment ideas. Learn more
In today’s issue
Cartoon: Lowe interest rates
Interest rate holes in the hull (4 minutes)
Cost of capital (3 minutes)
Global stocktake (3 minutes)
Rank and file (1 minute)
Credit creation, cause and effects (5 minutes)
Debt cycle monitor (1 minute)
Investment idea (16 minutes)
“Money is the measure of value, but to regard it as having value itself is a relic of the view that the value of money is regulated by the value of the substance of which it is made, and is like confusing a theatre ticket with the performance”
— John Maynard Keynes
Cartoon: Lowe interest rates

Interest rate holes in the hull
Can higher interest rates cause higher inflation? Paradoxically, yes.
•••

Economic lore tells us that the remedy for high inflation is to push up interest rates. Higher rates, economists say, limit lending and pull prices down. But the relationship is more complex than that. Higher rates can create inflation if there’s much debt. Workers demand raises to cover their mortgages. Companies hike prices to maintain profitability. And the government’s increased interest payments create new money.
Jerome Powell, the boss of the Federal Reserve, finds himself trapped between a rock and a hard place. He wants to increase rates to snuff out inflation. But rate hikes are a blunt tool and might even make inflation worse.
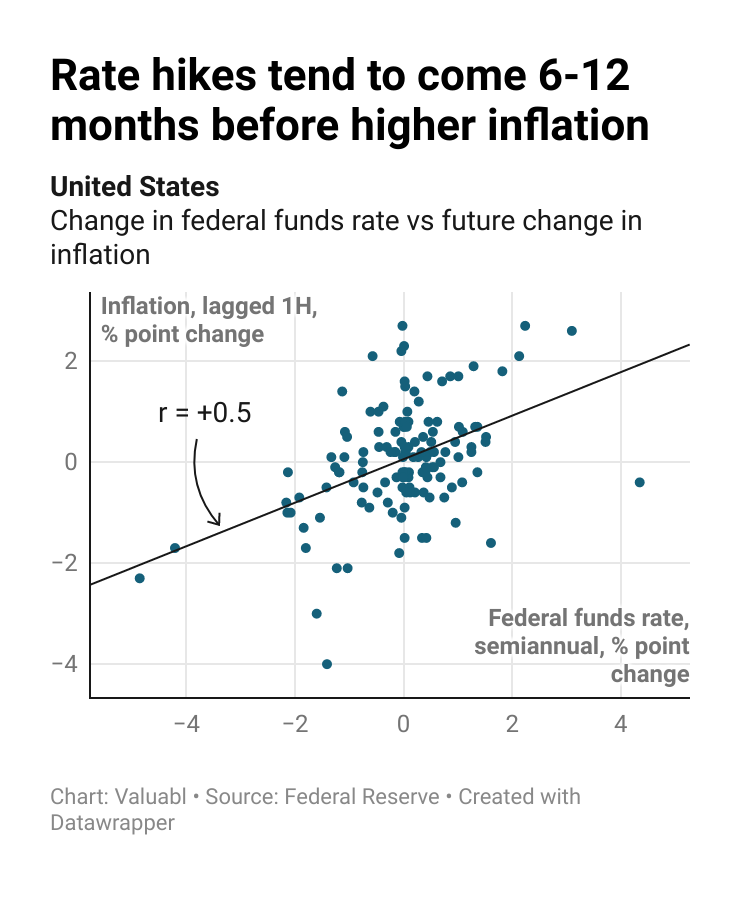
First, when rates rise, businesses pay more to borrow. A higher interest bill makes them lift prices to maintain profits. Price increases create inflation and lead to higher rates again. Federal Reserve data from 1955 shows that inflation tends to rise a year after the bank hikes. It could be that central bankers raise rates before inflation picks up. But that means rate hikes don’t work fast enough.
Second, elevated rates make mortgage and loan payments rise. Workers, squeezed by tighter budgets, push for pay raises. And businesses lift prices to cover the higher labour cost, creating inflation. The correlation between rate hikes and wages (+0.3) is less than consumer prices (+0.5), but it’s still there. Worker pay usually goes up within a year of rate hikes.
Third, higher rates make the government’s interest bill go up. Those interest payments create new money if the private sector owns the bonds. As the Fed pays its profits back to the Treasury, the state pays itself when it pays interest to the central bank. The right hand gives to the left—no new money. But if the private sector owns the bonds, the state creates money to pay the interest.
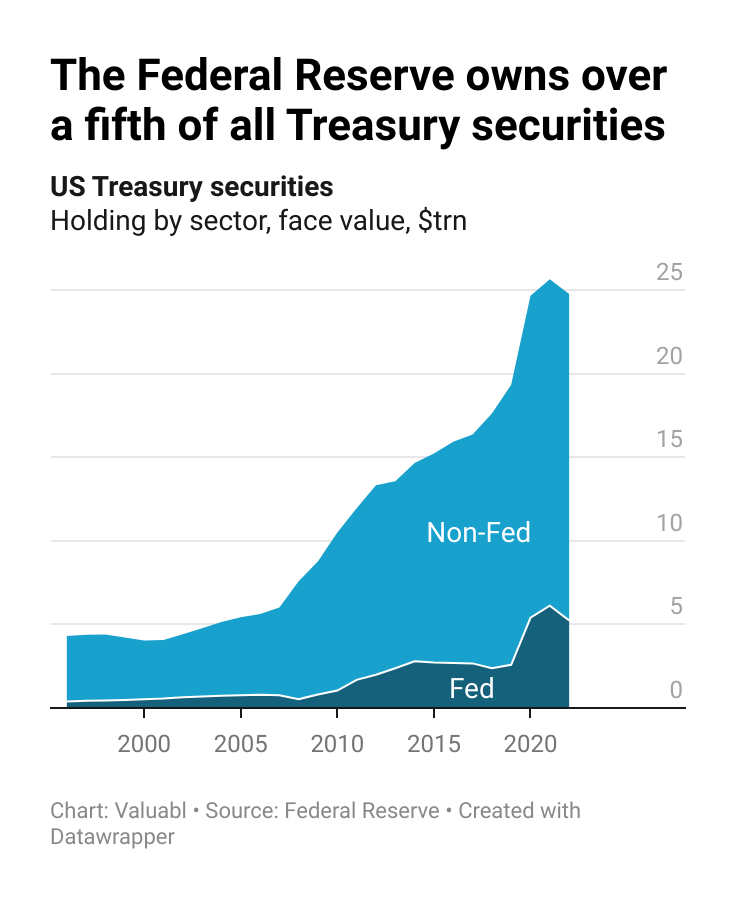
SIFMA, a financial industry group, estimates the Fed holds a fifth of all Treasury bonds. That means 80% of the state’s interest payments, which are now $853bn per year, go to the private sector. That’s $682bn, or 2.6% of GDP, of new money per year.
The relationship between interest rates and inflation is complex. When the central bank sells bonds, a process called quantitative tightening, rates go up. Economists reckon this cuts inflation. But if that pushes bonds into private hands and rates rise, the state creates more money to pay the interest. That adds to demand.
Currently, the Fed owns a large percentage of Treasury bonds. In 1996, for example, it held 9% compared to the 20% it has now. That growth capped the past impact of higher interest rates on money creation.
Jerome is stuck. If he sells Treasuries, rates will go up, and the state’s interest bill will stimulate demand. If he buys bonds, rates will drop, and the interest bill won’t add to demand. But this goes against economic orthodoxy.

The boat is filling up with water. Instead of plugging the leak and bailing water over the side, Jerome is drilling new holes to let it out.
Good luck with that.
Cost of capital
Finance’s most important yet misunderstood price is capital. Here’s what happened to the cost of money in the past fortnight.
•••
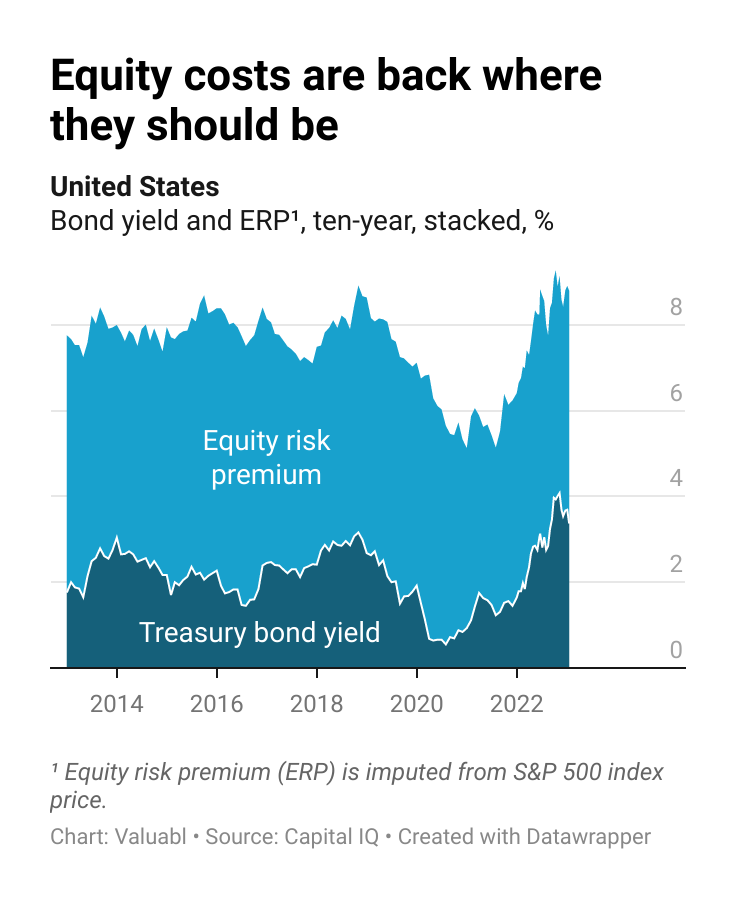
Stock prices rose last fortnight. The S&P 500, an index of big American companies, climbed 1% to 4,136. The market continues to rise from its October lows but is still 7% below where it was last year. I value the S&P 500 at 4,209, which suggests it is fair value.

The companies in the index earned $1,658bn in the past year, down $83bn from last fortnight. They paid out $407bn in dividends, bought back $884bn worth of shares, and issued $64bn of equity.
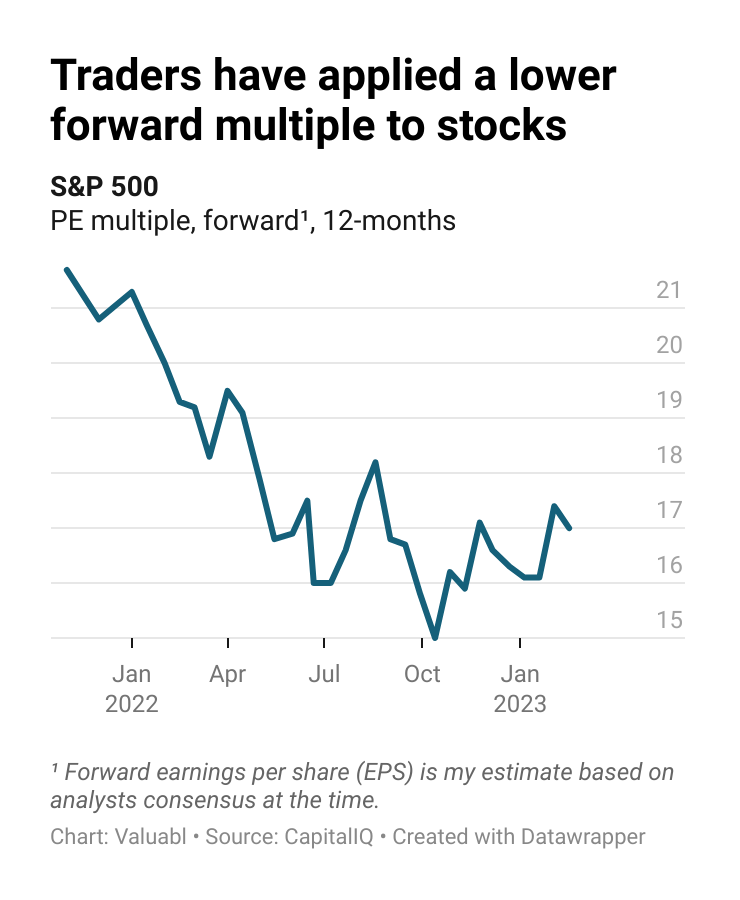
The forward price-earnings (PE) ratio dropped to 17. My 12-month forward earnings per share (EPS) estimate for the index rose from 237 to 244.
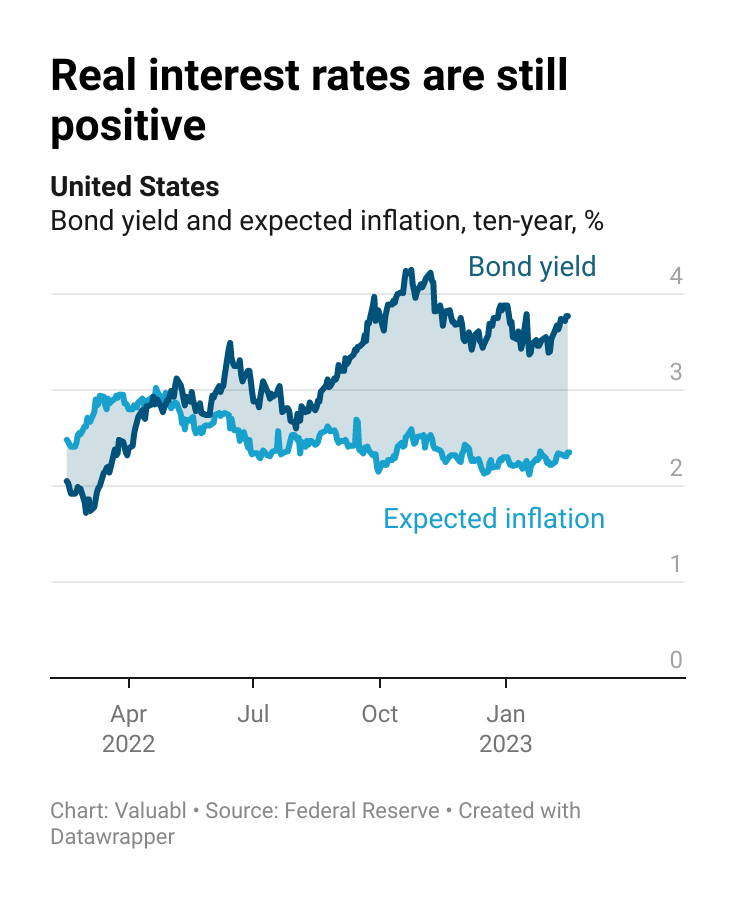
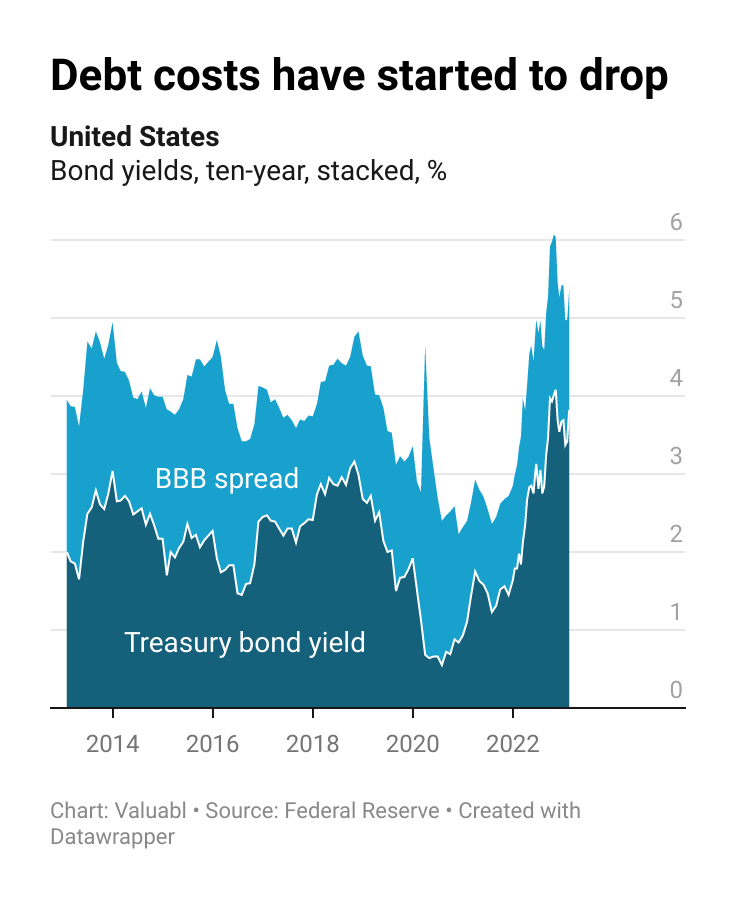
Government bond prices dropped. Yields, which move the opposite way to prices, rose with inflation expectations. The ten-year Treasury yield, a critical financial variable, climbed 38 basis points (bp) to 3.8%. Investors expect inflation to average 2.4% over the next decade. That's 10bp higher than the rate they expected last fortnight.
The real interest rate, the gap between yields and expected inflation, increased by 28bp to 1.4%. These inflation-adjusted rates are up almost two percentage points in the past year.
Corporate bond prices also went down. Credit spreads, the extra return creditors demand to lend to a company instead of the government, fell by 2bp to 1.5%. The cost of debt, the annual return lenders expect when lending to these companies, jumped 36bp to 5.3%.
Refinancing costs have almost doubled, up two percentage points, in the past year. But they’ve been declining since they peaked in October above 6%.
The equity risk premium (ERP), the extra return investors want to buy stocks instead of bonds, climbed 29bp to 5.2%. It’s now about the same as it was a year ago. The cost of equity, the total annual return these investors expect, also rose 67bp to 9%. These expected returns are a little above their long-term average.
Global stocktake
Valuing regional and global stock markets to help us find the best ponds in which to fish for value.
•••
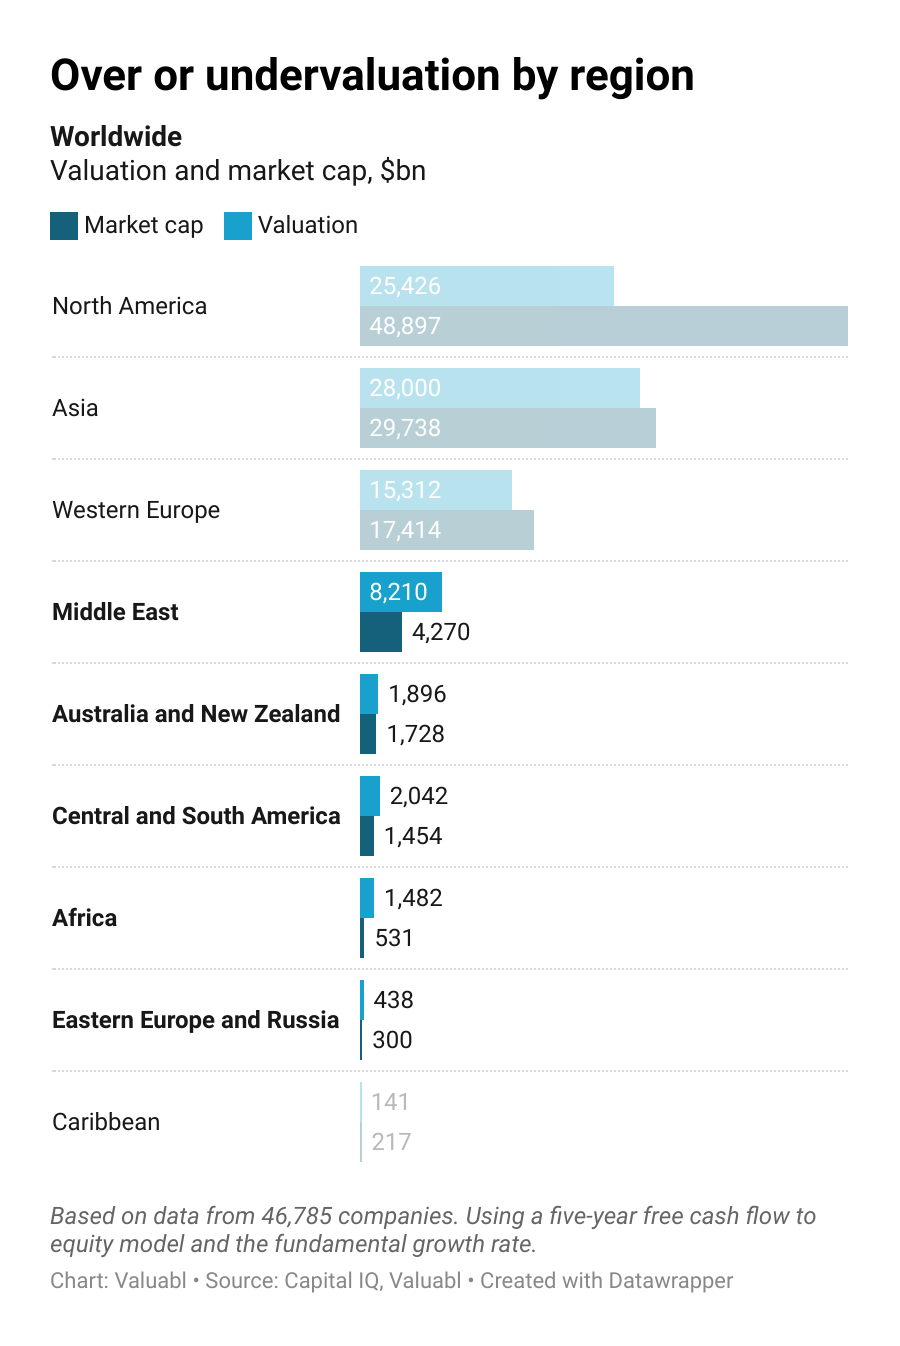
I used a five-year free cash flow to equity (FCFE) model to value all stocks at $83trn. This model used the growth predicted by returns on equity and retention ratios. It suggests stocks are worth 13% less than last fortnight. But given the $104trn price tag, global share markets, on average, look overvalued.
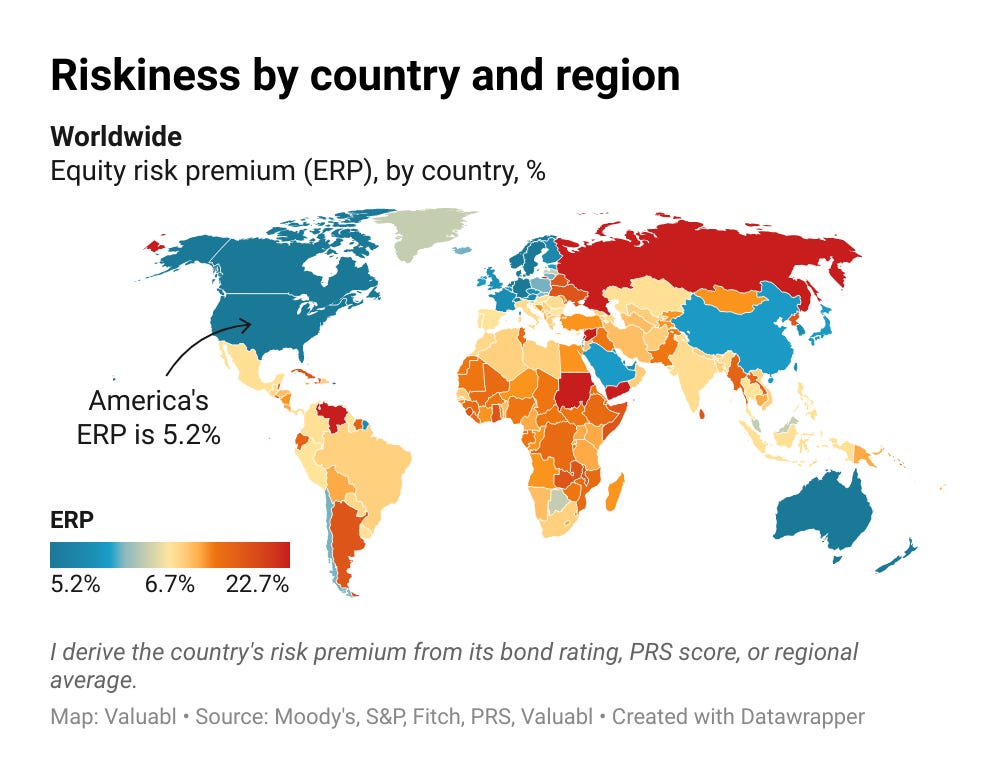
Valuations by region
African, Middle Eastern, and Eastern European stocks are cheap. North American, Asian, Western European, and Caribbean stocks are expensive.
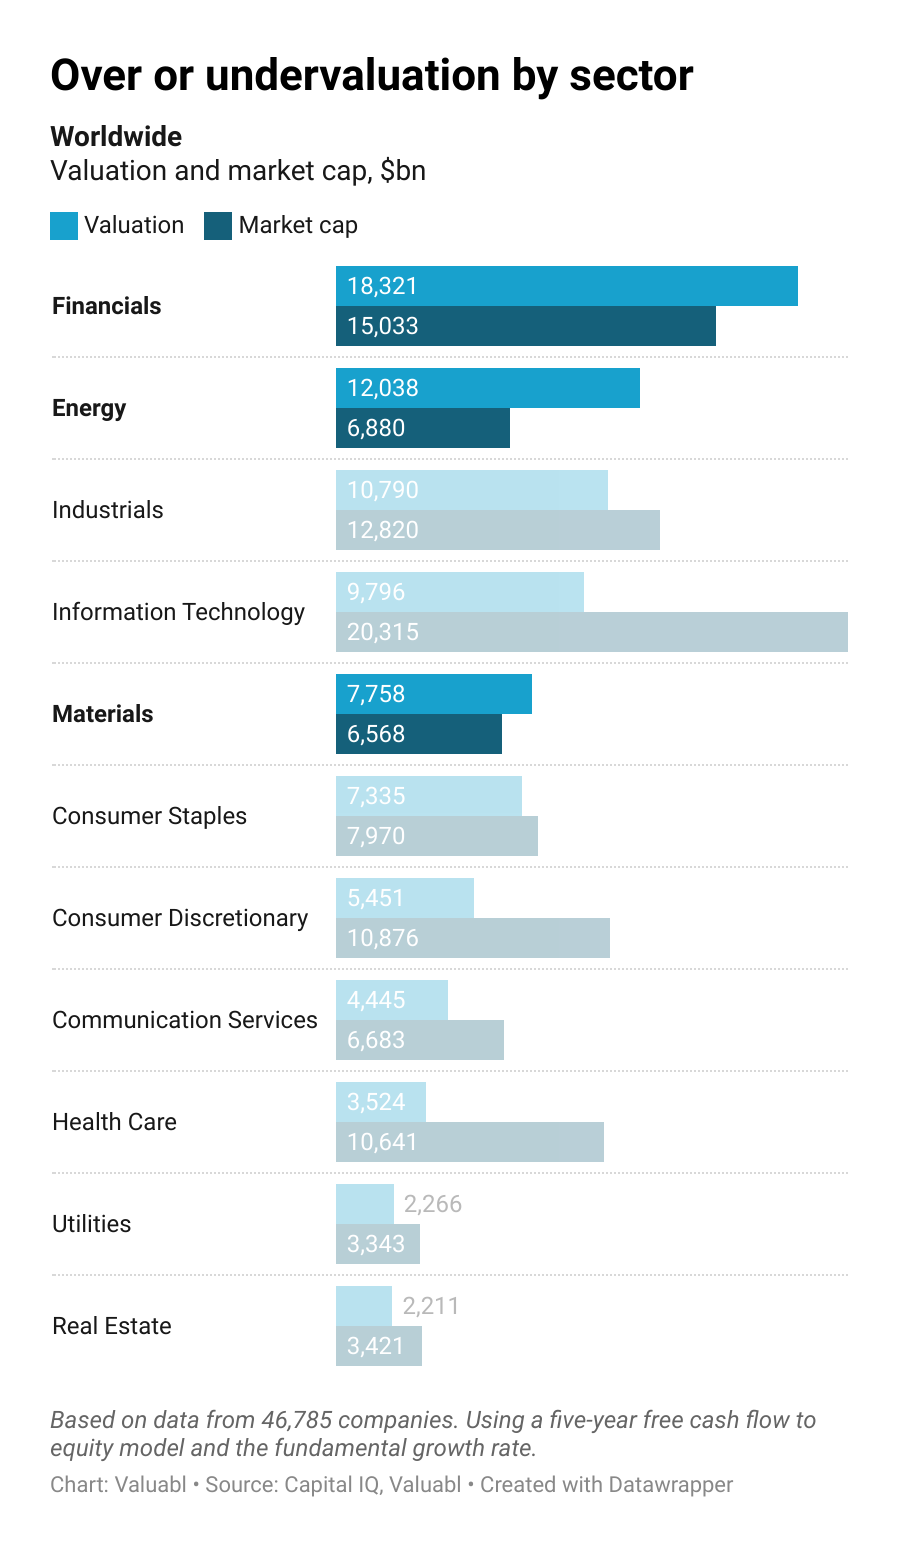
Valuations by sector and industry
Energy, Financials, and Materials companies look the most undervalued. While Health Care, Information Technology and Consumer Discretionary stocks look overvalued.
Country and regional risks
The global equity risk premium rose to 6.7%.
Moody's, a rating agency, downgraded Egypt's credit rating from B2 to B3. They said that as the country becomes export-focused, it will not be able to absorb shocks as well. They also downgraded Ukraine from Caa3 to Ca. They reckon the war will have long-term adverse effects on the economy.
Regional and sectoral data
Public companies have $46trn of common equity invested in them. That equity earned a 12% after-tax return in the past year.
Middle Eastern, African, and South American companies made the most profit per dollar. But Caribbean and Asian companies are lousy allocators of equity capital.
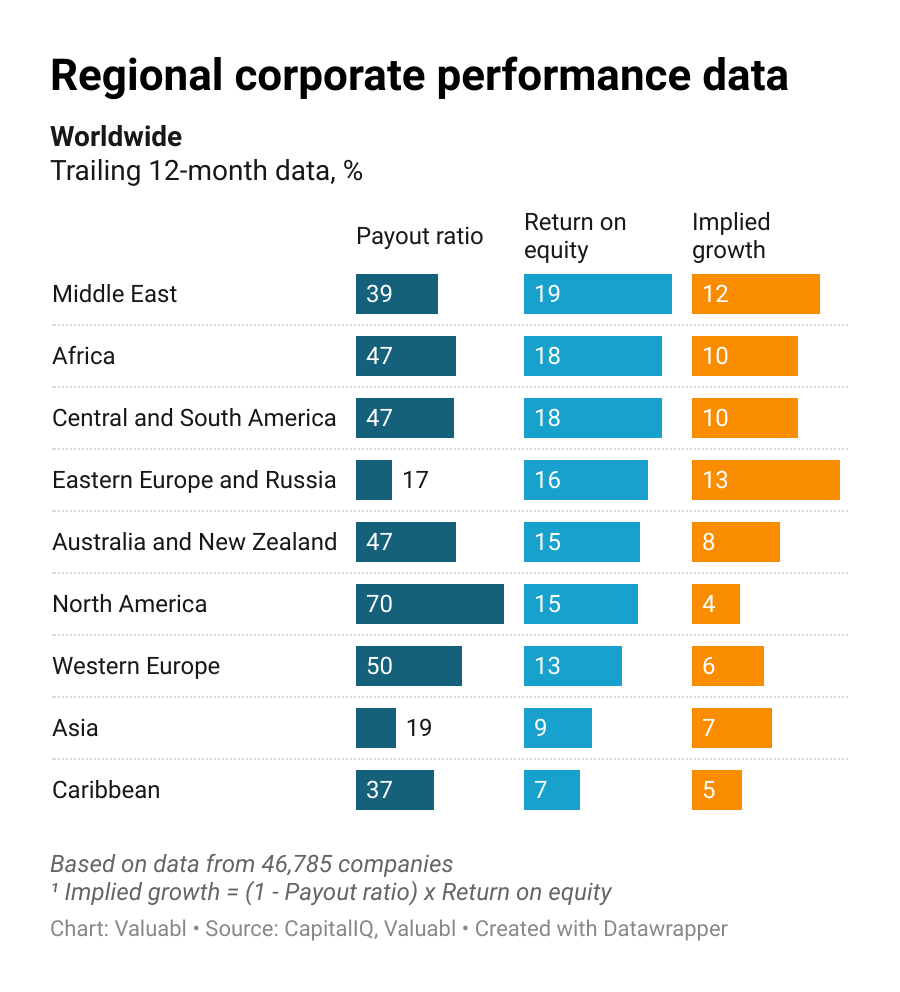
Middle Eastern, Eastern European, and African firms should grow the quickest. Companies there have the highest fundamental growth rates predicted by reinvestment and returns. While North American and Caribbean ones are likely to be the slowest growers. North American firms only reinvest one-in-three dollars of profit. But Caribbean companies earn a crummy 7% on equity.
Businesses in the energy sector should expand the fastest. They earn a whopping 23% on equity and reinvest half their profits.

This measure isn't perfect, but expansion in these industries should pull inflation down. Rising energy, material and industrial prices pushed costs up elsewhere. As these sectors reinvest and expand, production will increase, and prices will drop. This disinflation has already started to feed into lower producer prices.
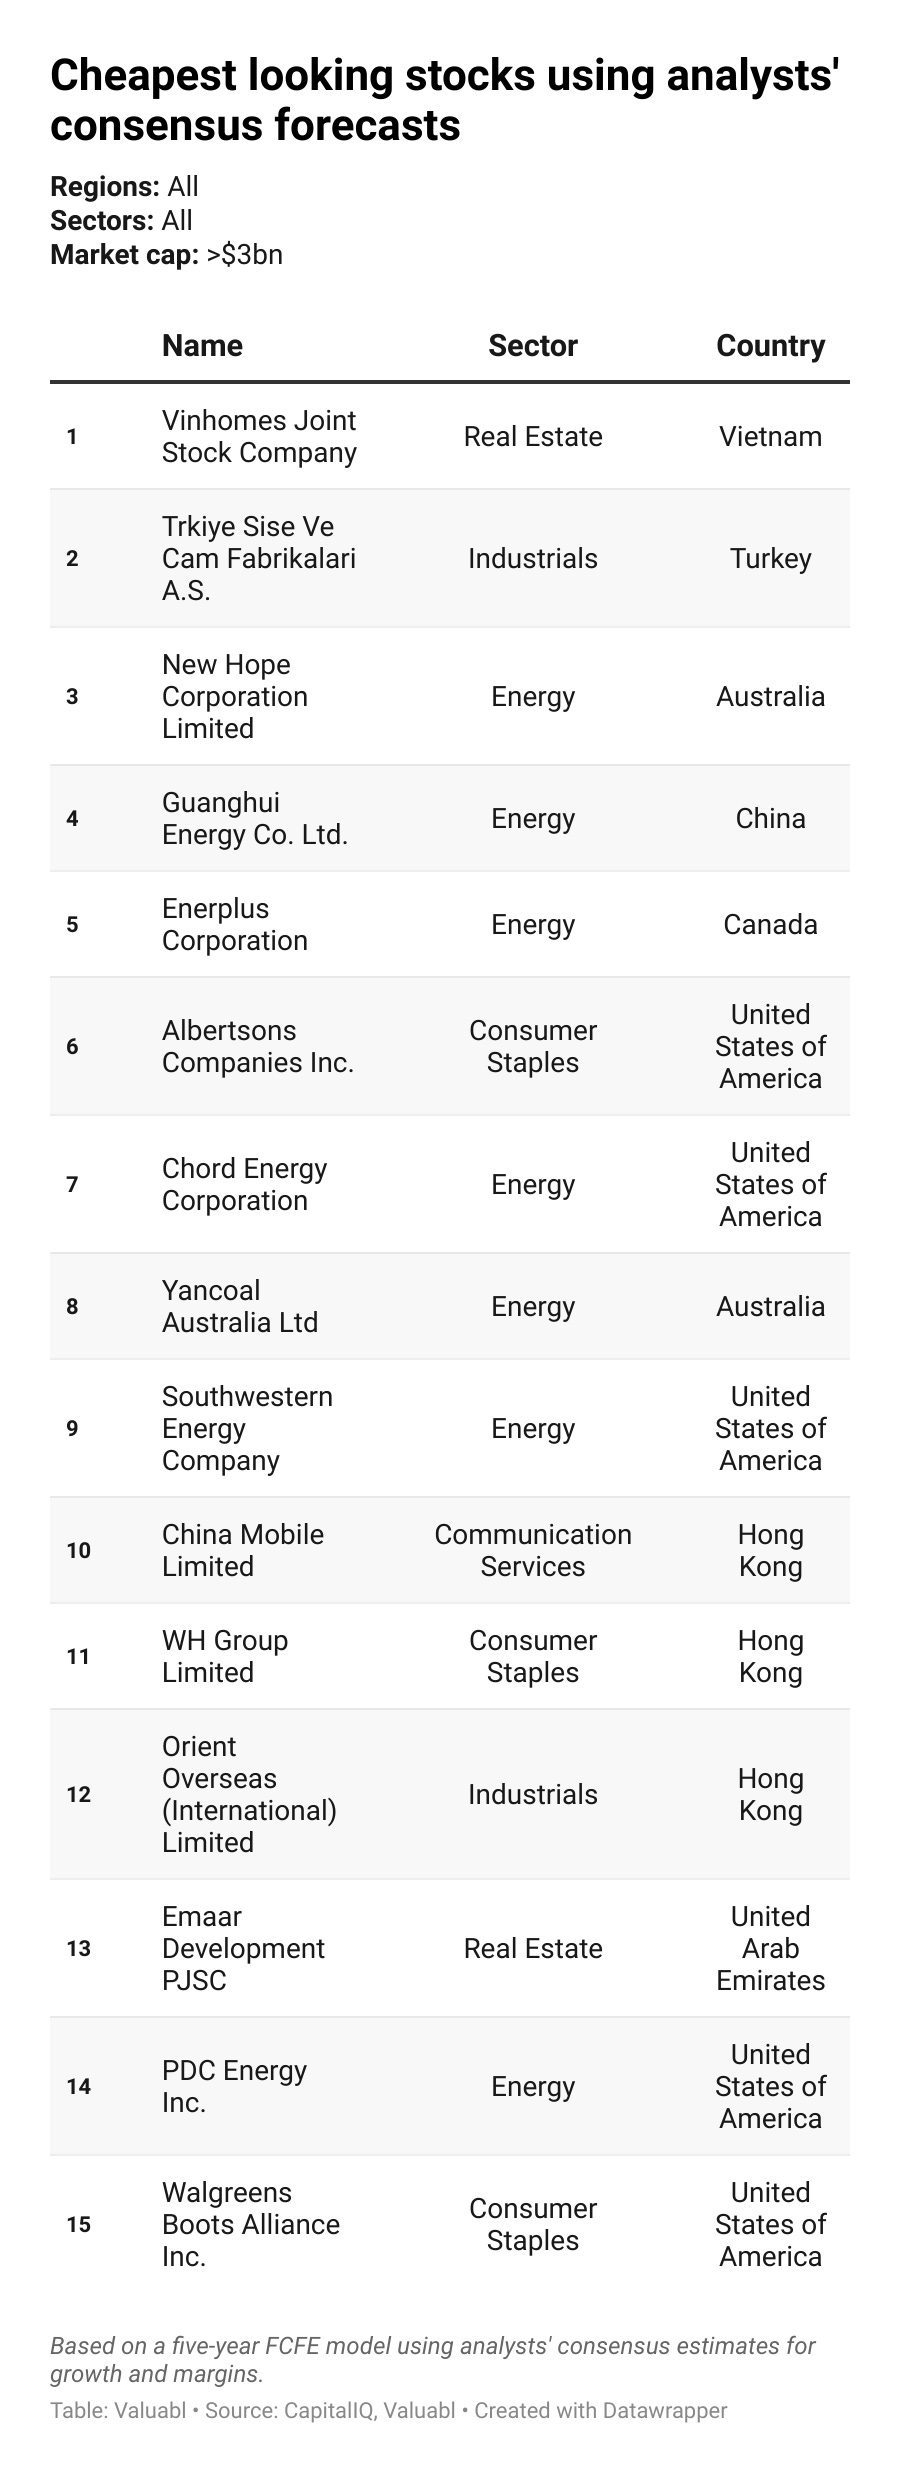
Rank and file
Screening and valuing the cheapest stocks in undervalued regions and sectors.
•••
Screening criteria
Regions: All
Sectors: All
Market cap: >$3bn
Model: Five-year free cash flow to equity (FCFE) model using analysts’ consensus estimates for growth and margins.
Credit creation, cause and effect
The Federal Reserve buys and sells securities and sets interest rates. It targets borrowing costs, money creation, price stability, and productivity, with varying effects.
•••
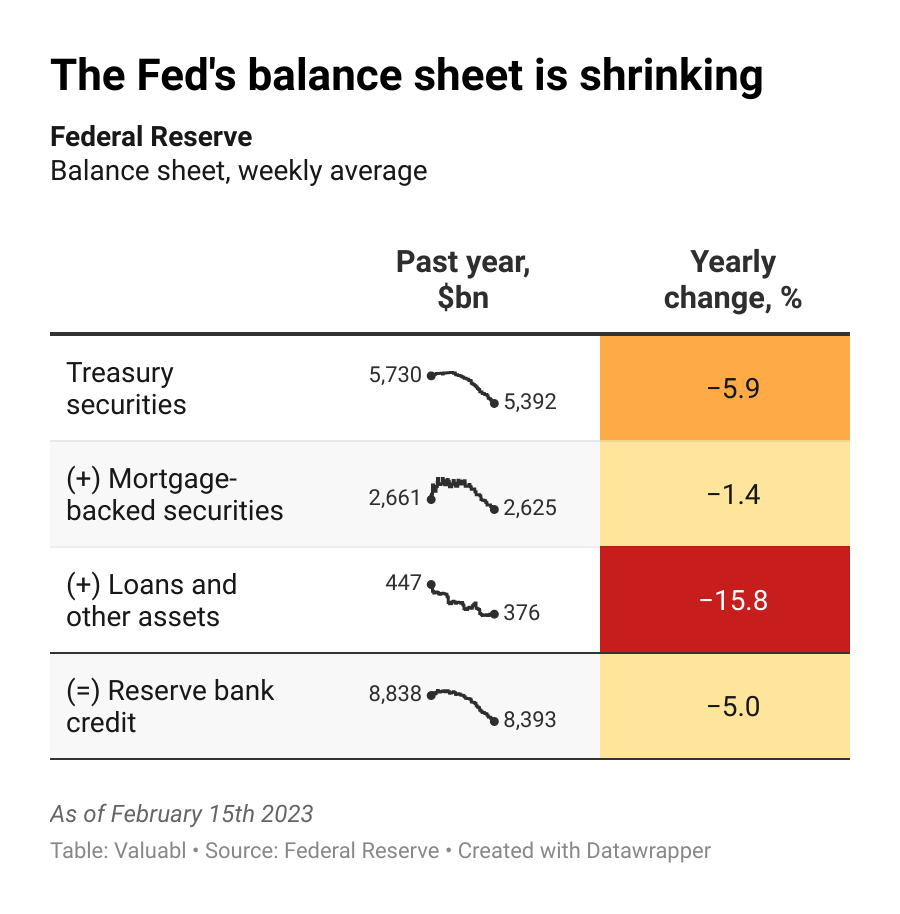
The Federal Reserve buys and sells securities
The balance sheet shrinks
Last fortnight, the Fed trimmed $32bn from its Treasury security position. It also cut $153m from its mortgage-backed security (MBS) holding. The total amount of Reserve Bank credit shrank by $30bn. The Fed’s balance sheet reduction plan is in full swing.
And sets interest rates
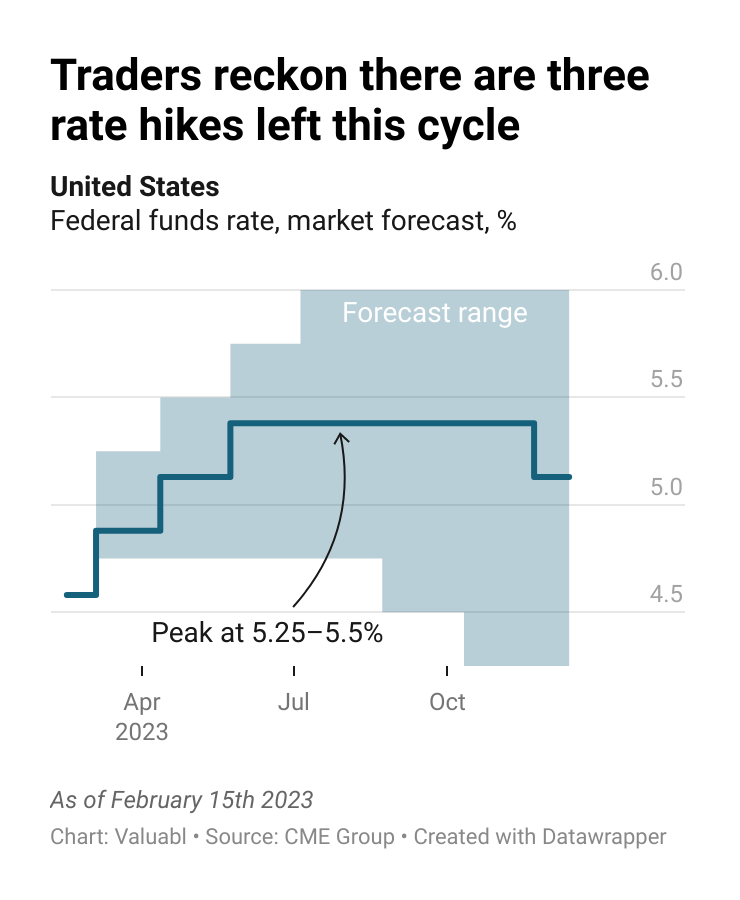
Traders reckon there are three rate hikes left
The federal funds rate is between 4.5-4.75%. Traders think the central bank will hike three more times this cycle, and rates will peak at 5.25-5.5%. Those traders have priced in 25bp hikes at the March, May and June meetings. But they also reckon the Fed will start to cut rates in December
To influence: borrowing costs
Markets expect a recession later this year
The yield curve has inverted from six months outward. Bond traders reckon a recession is coming, and the Fed will start to cut rates in less than a year. The long end of the curve still hovers around 4%.

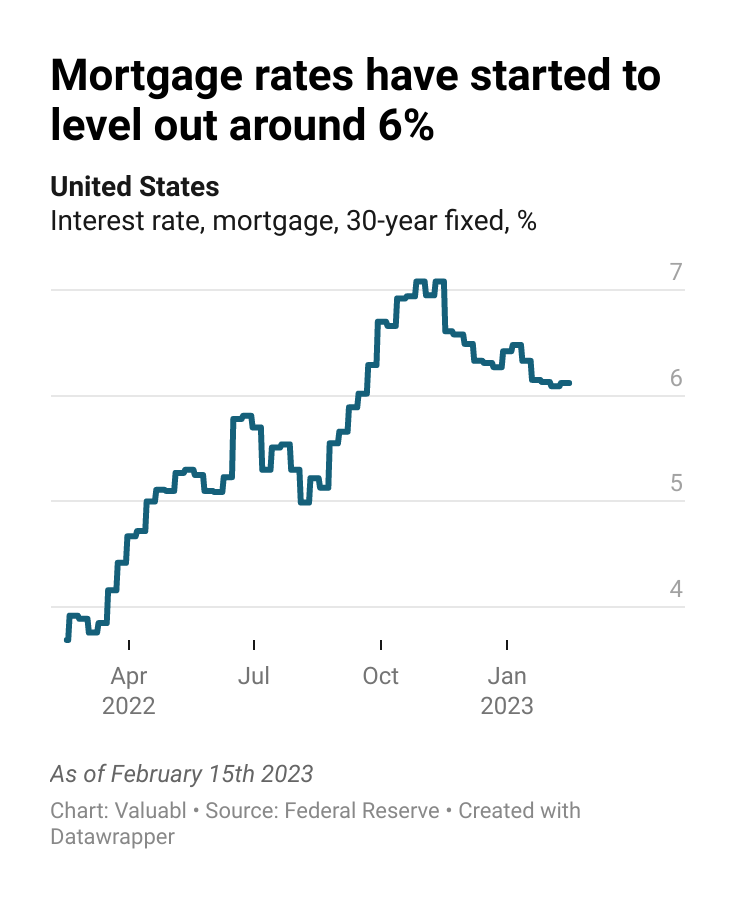
Mortgage rates have started to level out
American homebuyers will pay 6.1% for a new 30-year fixed-rate mortgage. That rate is much higher than the 3.7% rate they paid a year ago. As a result, the Fed’s housing affordability index fell by a fifth in that time. Prospective homeowners cannot afford to buy, which has started to put downward pressure on prices.
Money creation
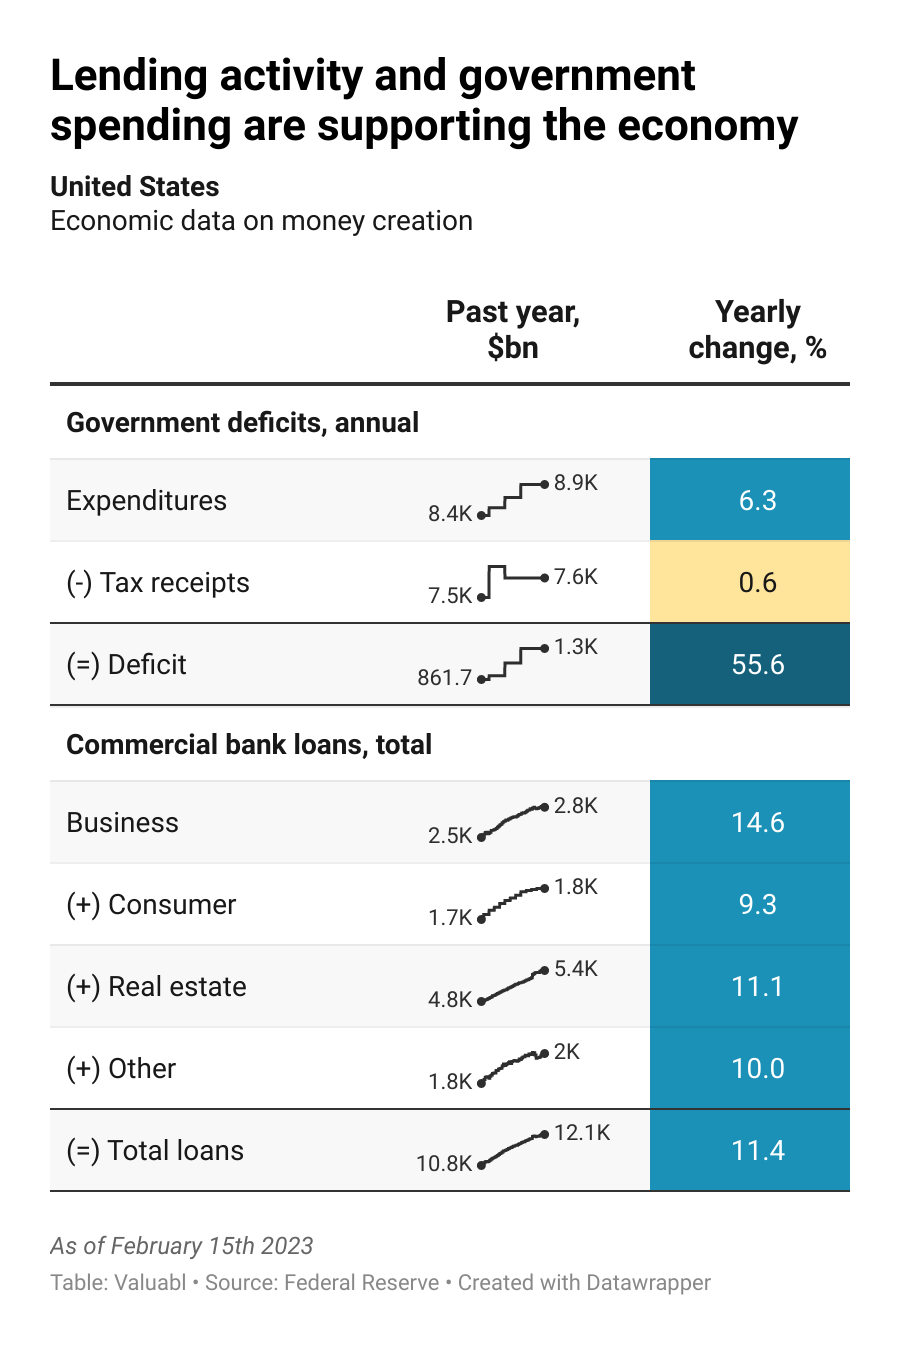
Bank lending and government spending have supported the economy
It continues to seem like nothing can slow Americans’ thirst for debt. Despite higher rates, shoppers, bosses, and landlords have borrowed more. Total bank loans are up 11% in a year.
The government has spent more than it received in taxes. That net spending put new money into the economy and supported economic growth. The deficit will grow if higher rates continue to lift the government’s interest bill—13% of current government expenditures already go to interest.
Price stability
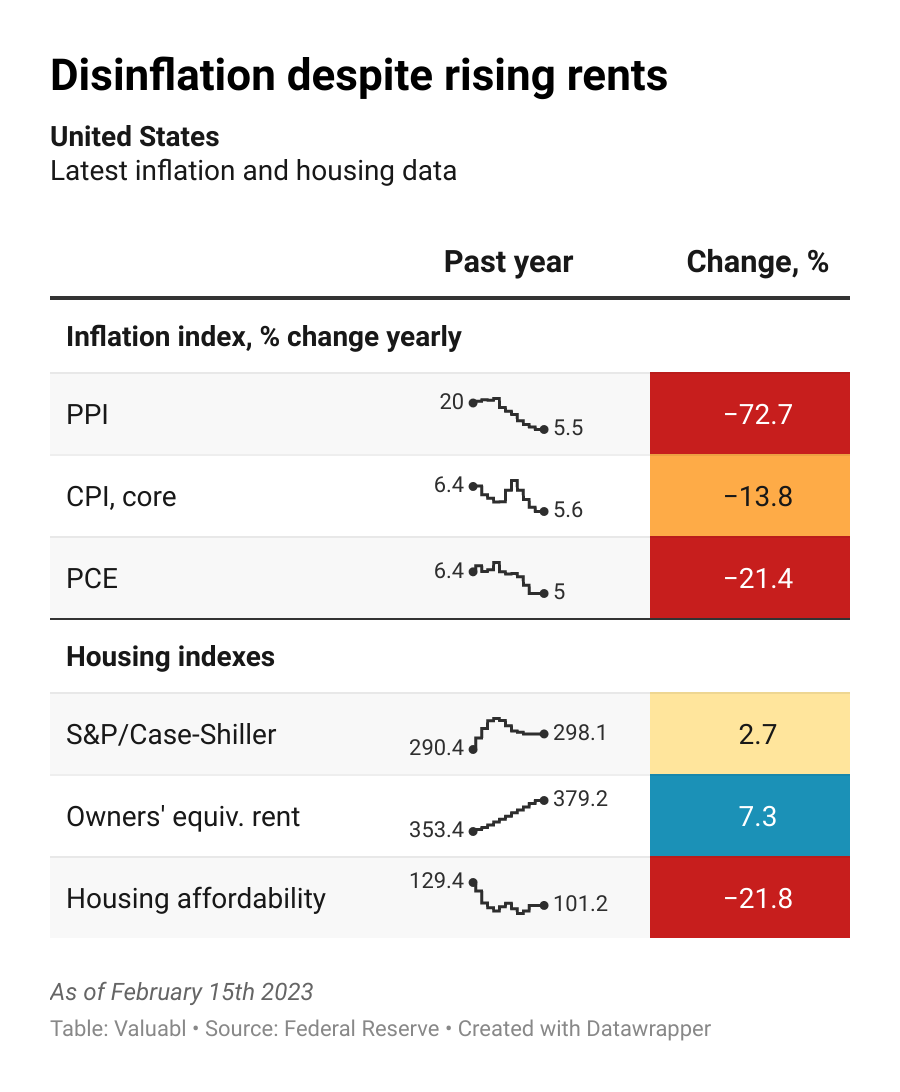
Inflation has peaked, but rents continue to rise
Inflation is on its way down. The rate of increase in the producer price index (PPI) has dropped from 20% to 5%. The core consumer price (CPI) and personal consumption expenditure (PCE) indexes have peaked. Supply constraints have eased, but rents continue to climb. They’re up 7% in the past year. We’re in a housing crisis as households, squeezed by rising rates and rents, struggle to afford a place to live. House prices have started to fall, but it’s not enough to offset higher mortgage costs.
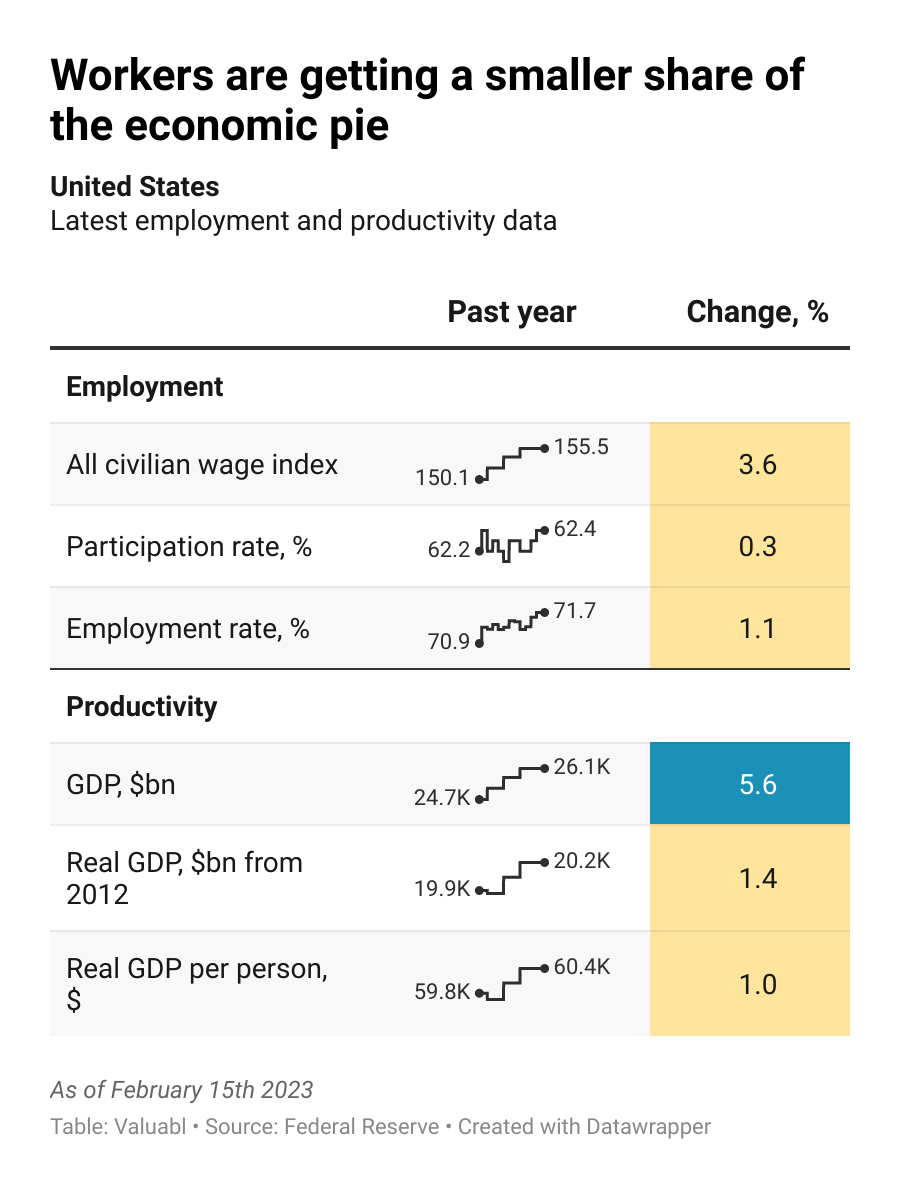
And productivity
Real wages have dropped
Workers, irked by a cost-of-living squeeze, haven’t received adequate raises. With wages up 4% and inflation above 6%, real wages have dropped. This lack of labour cost pressure has helped prevent an inflationary spiral. Unemployment is still low, and the labour market is strong.
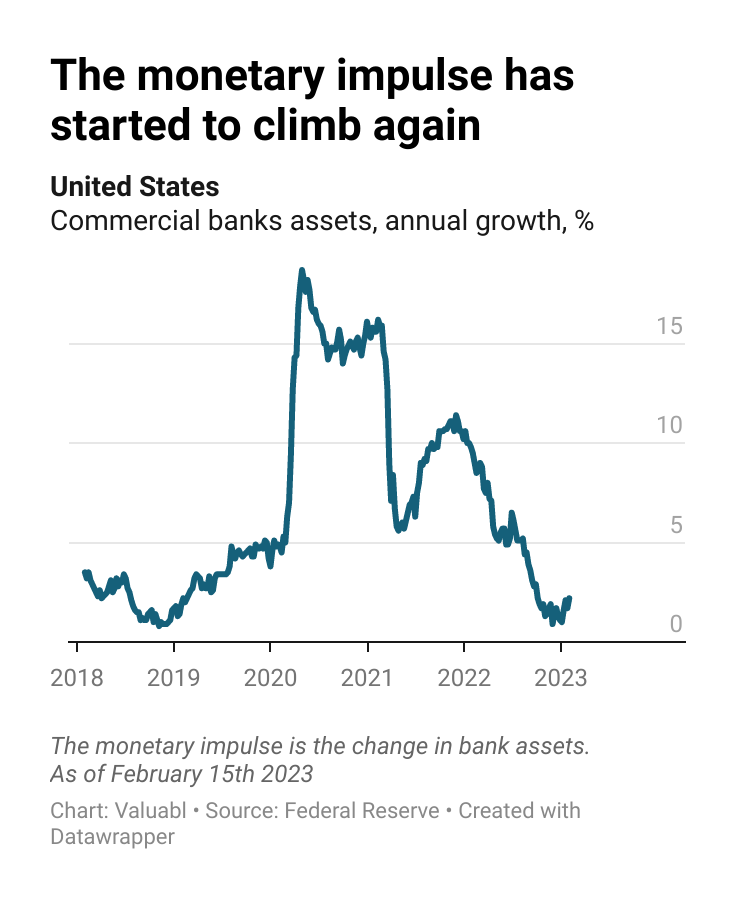
With varying effects
Bank expansion suggests a recession is avoidable
The monetary impulse, the change in commercial bank assets, has ticked up. The money supply and economy are still expanding. In the past year, the monetary impulse grew by 2.2%, one of the slowest expansions recently. But this growth makes it less likely that a recession is around the corner.
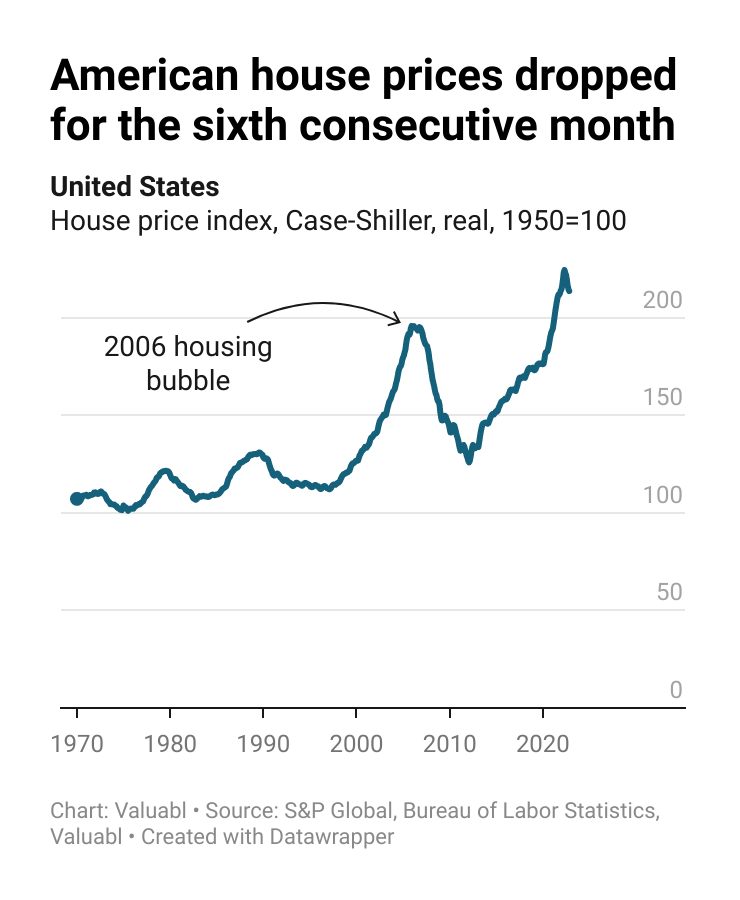
American house prices have fallen for six straight months
For the first time since 2006, American house prices have started to fall. In inflation-adjusted terms, they’ve lost 5% since their May 2022 peak, or a 10% annualised drop. That pace of decline is the fastest since the depths of the global financial crisis (GFC).
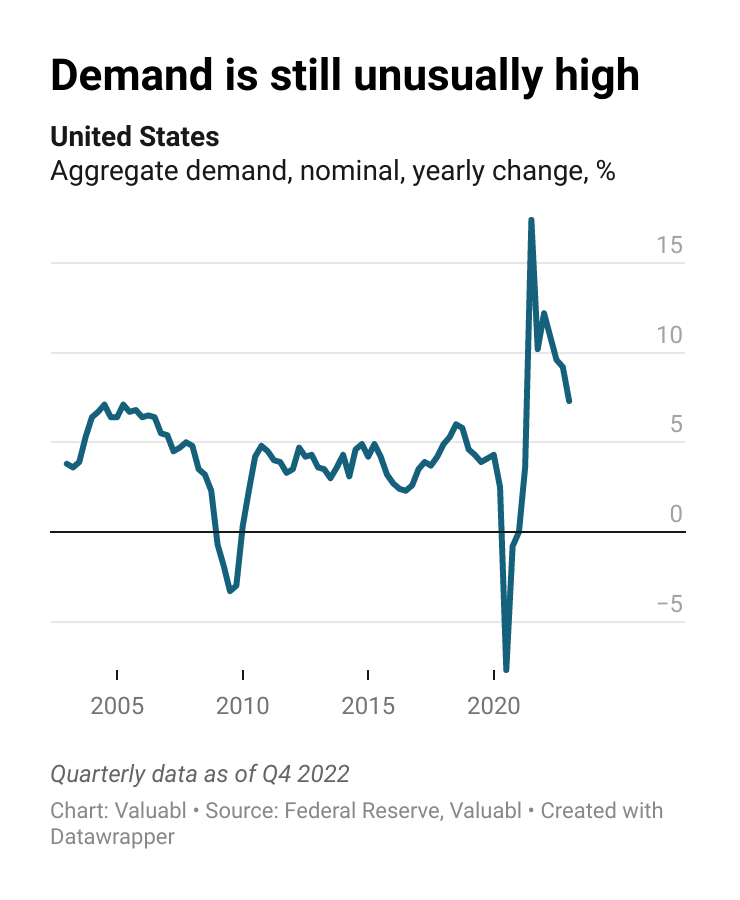
Total demand is still high
As of the fourth quarter of last year, nominal demand was still 7% higher than the year before.
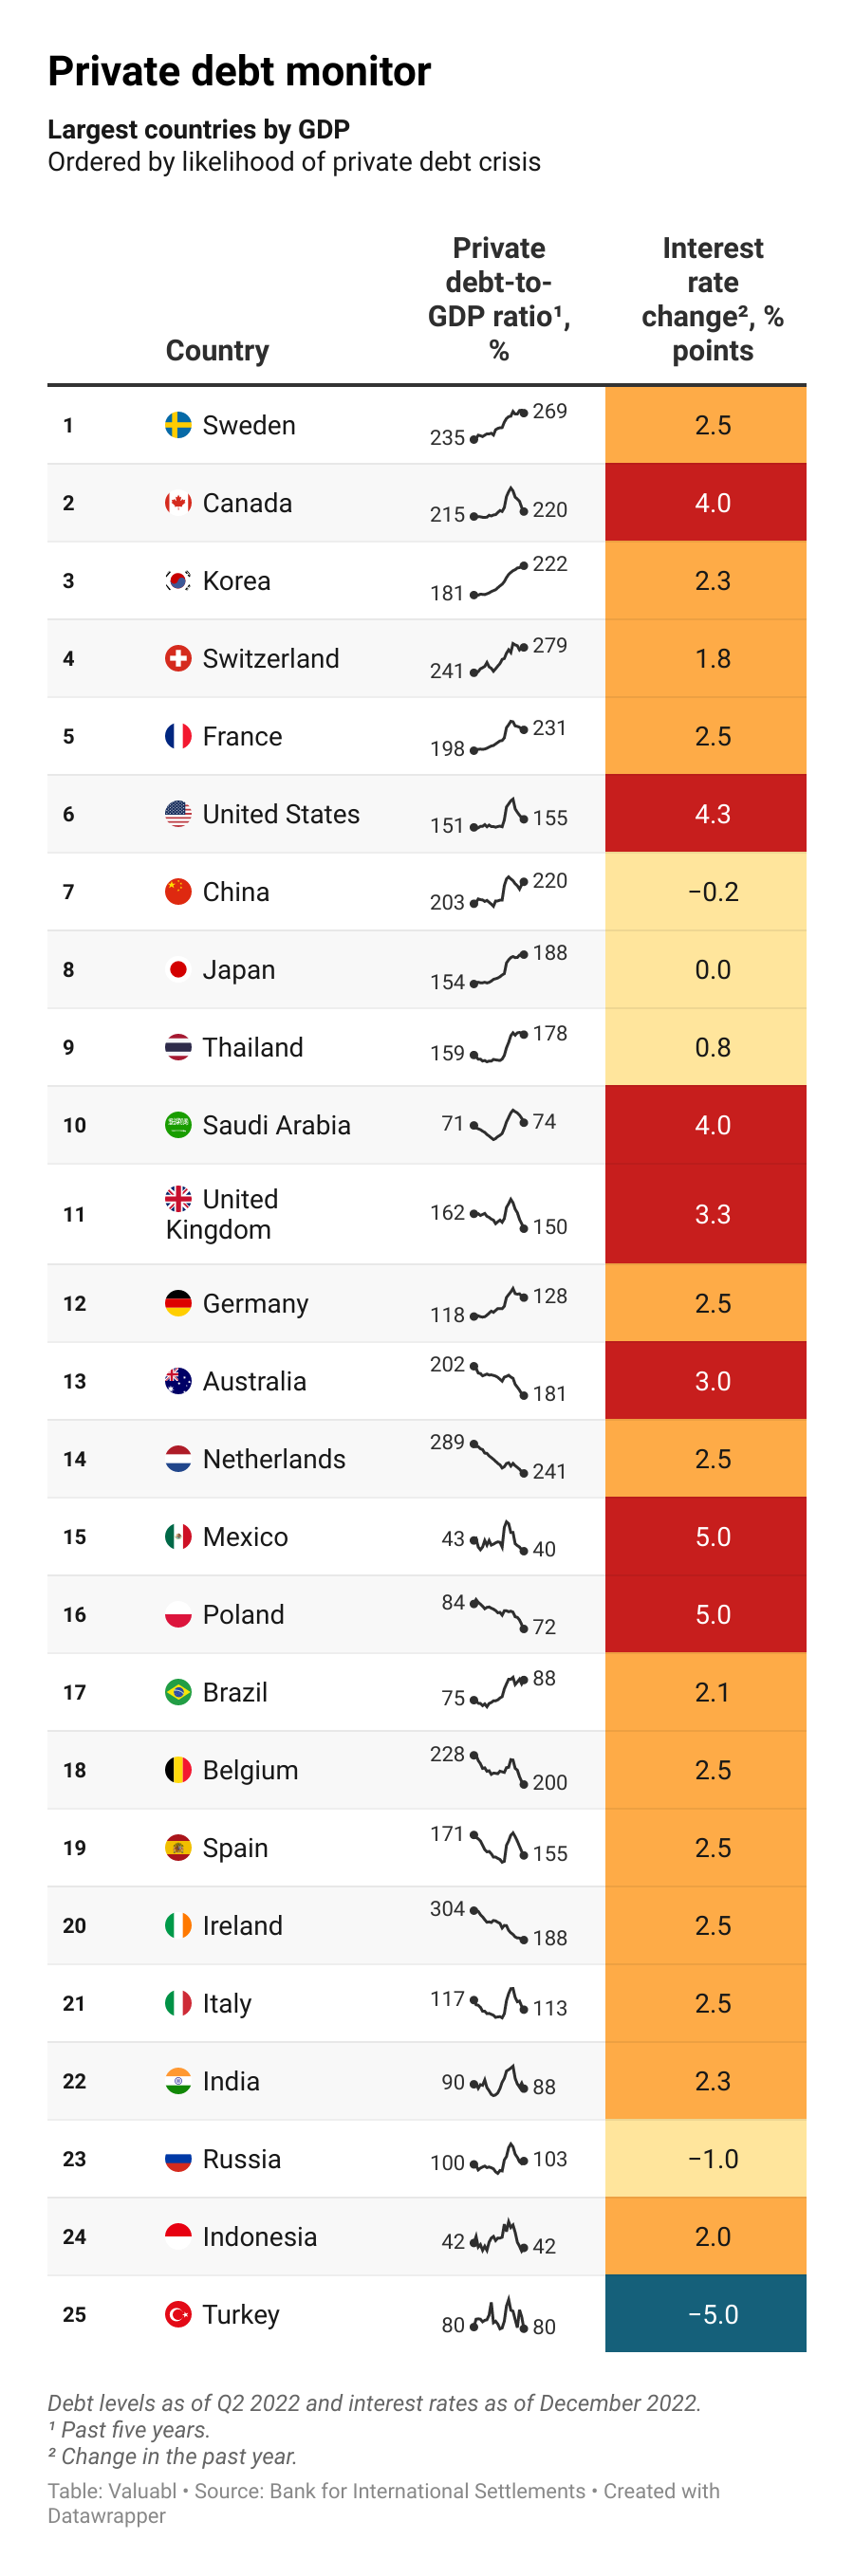
Debt cycle monitor
Private debts are a better economic crisis indicator than public debt. High and growing levels of private debt weigh on demand. Interest rate hikes make the debt more difficult to maintain and can kick off a deleveraging.
•••
Risk of private-debt crisis
High¹: France, Korea, Sweden, Switzerland, Thailand
Medium²: Australia, Belgium, Brazil, Canada, China, Ireland, Japan, Netherlands, Spain, United Kingdom, United States
Low³: Germany, India, Indonesia, Italy, Mexico, Poland, Russia, Saudi Arabia, Turkey
¹ High-risk: Country has a private debt ratio > 150%, five-year growth in private debt > 10 percentage points, and interest rates going up.
² Medium-risk: Two of the three criteria above.
³ Low-risk: One or less of the three criteria above.
Investment idea
To help readers buy low and sell high, this is the best investment idea I found in the past fortnight.
•••
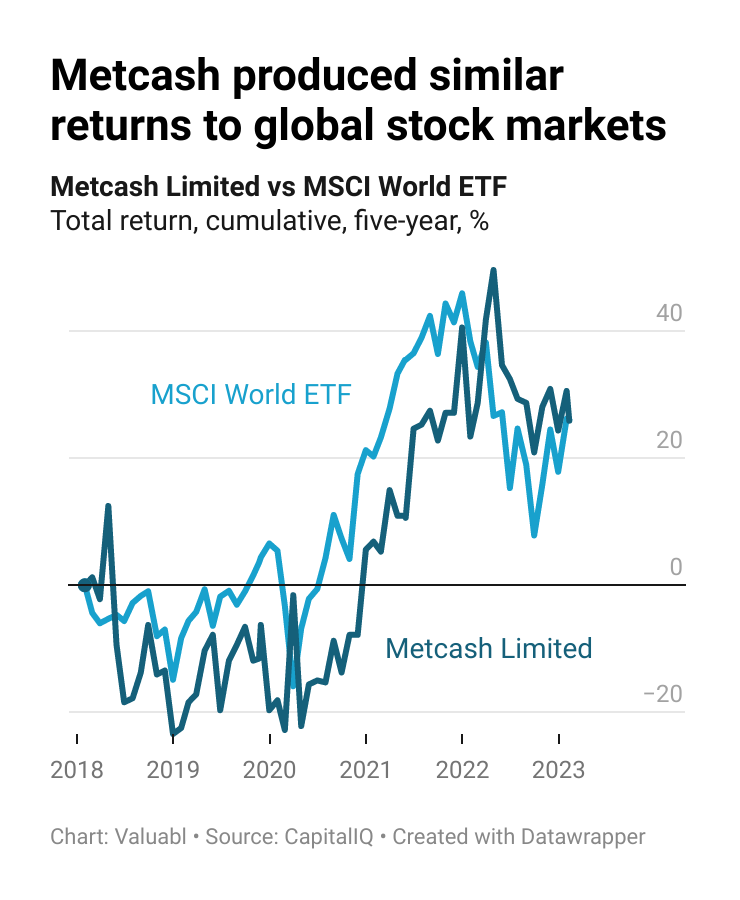
Metcash Limited
Thesis
Australia’s most extensive retail distributor and wholesaler wants to take market share from Woolies, Coles and Aldi. It’ll be hard. But price cuts and acquisitions will help somewhat. Economies of scale will stop margins from falling too far as rising costs squeeze profitability. I rate the shares a Buy as they offer a 48% upside and 8% IRR and are well-placed to handle a recession.
Summary
Company name: Metcash Limited
Ticker: ASX: MTS
52-week range: A$3.80–4.90
Market cap: A$3.9bn
Price: A$4.00
Target: A$4.70–7.50
Upside: +48%
Recommendation: Buy
I) Story
Business model
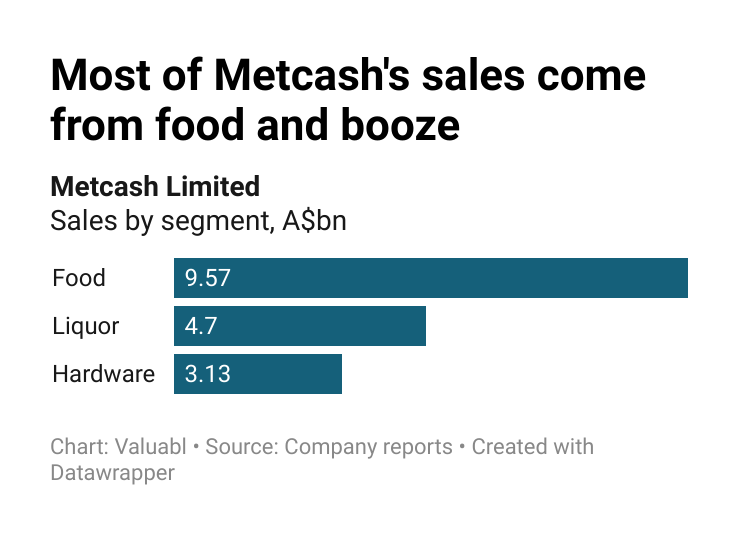
Metcash is Australia and New Zealand's largest wholesale distributor. The company supplies supermarkets (IGA, Campbell's, Foodland), hardware stores (Mitre 10, Home, Hardings, Total Tools), and liquor shops (Cellarbrations, The Bottle-O, IGA Liquor, Porters, Thirsty Camel, Big Bargain Bottleshop).
It has the broadest retail distribution network in Australia and is the country's biggest supplier to independent supermarkets, supplying 5,400 stores. It's also the second biggest liquor and hardware supplier.
Metcash gets 55% of its revenue from food, 27% from liquor, and 18% from hardware.
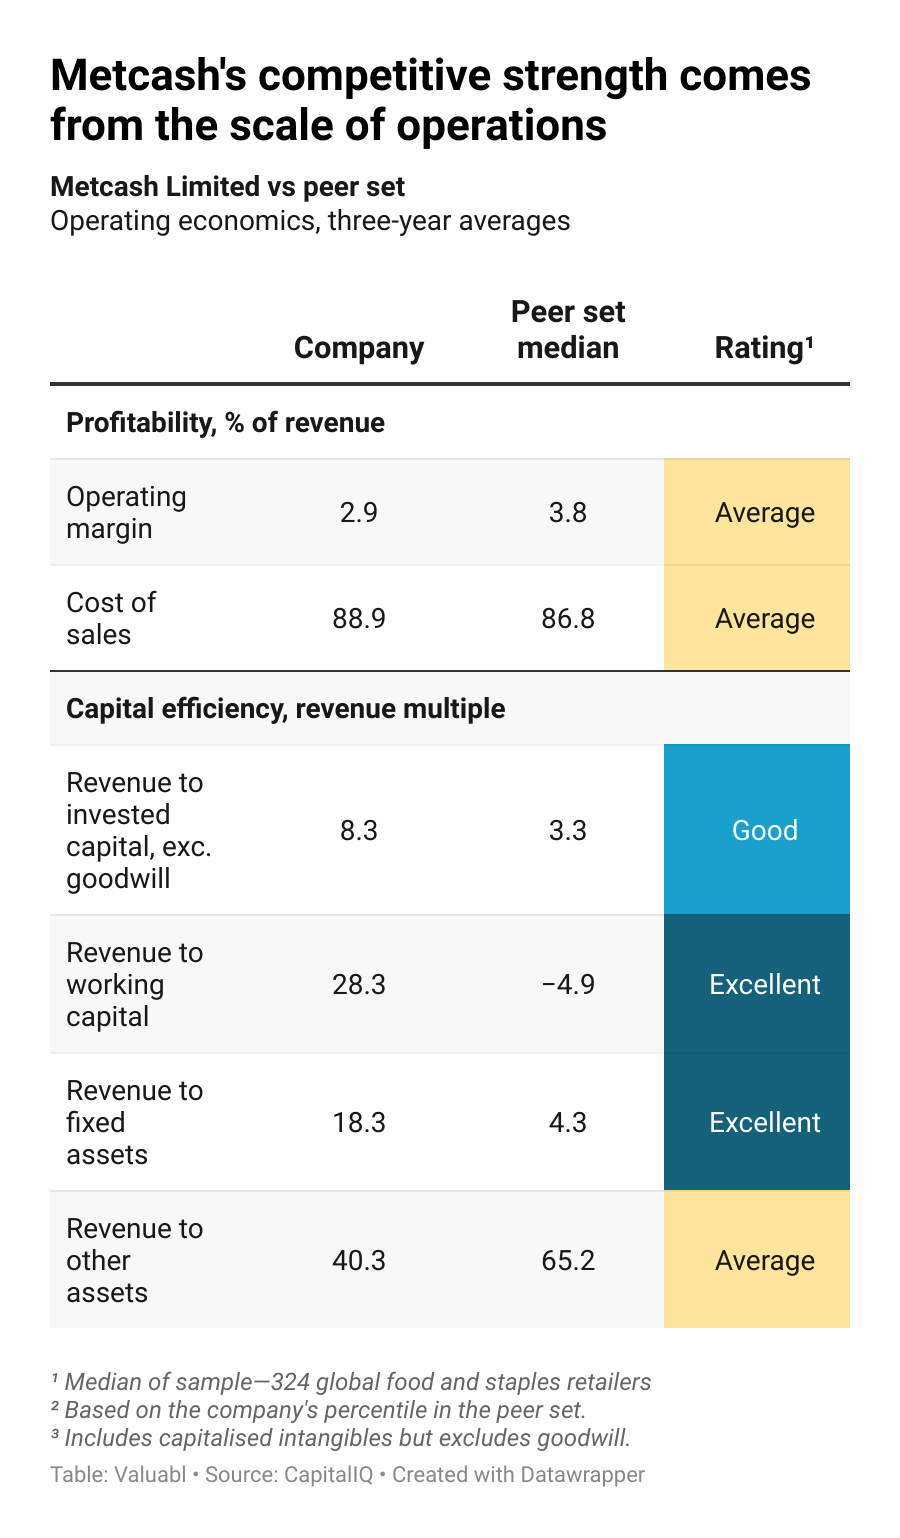
Competitive advantages
Economies of scale: Metcash, the biggest retail distributor and wholesaler in Australia, benefits from economies of scale. It can serve more shops on a per-warehouse basis than other firms helping it get more revenue from its fixed assets than others. As it's a distributor to independent shops, not a supermarket itself, it holds less inventory and gets paid sooner. That helps maximise working capital turnover.
Opportunities
E-commerce: By improving its online footprint, Metcash can grow its top line. Australians' preference for grocery shopping online instead of in person lept during the pandemic and has continued since. With the largest network of shops in Australia, the company's online order and pickup value propositions are more attractive than its competition, as Metcash is more likely to have a shop or distribution centre close to the customer. That reduces delivery time and cost.
Own-brands: Metcash can improve its profitability by broadening the range of its own-brands to capture the margin it would otherwise pay suppliers. The average food, household, and personal products business in Australia and New Zealand has an EBIT margin of 5%—that's higher than the firm's margins. Own-branded products would boost the bottom line if they achieved average industry profitability.
Distress acquisitions: If there's a recession, the firm can buy up small, distressed retailers that go bankrupt. Over a fifth of the public retailers in Australia and New Zealand are already distressed with earnings that don't cover their interest bills. And the countries' central banks continue to hike rates. As it's already well-capitalised, the firm can quickly borrow or issue equity to complement its A$60m cash for an acquisition.
Catalysts
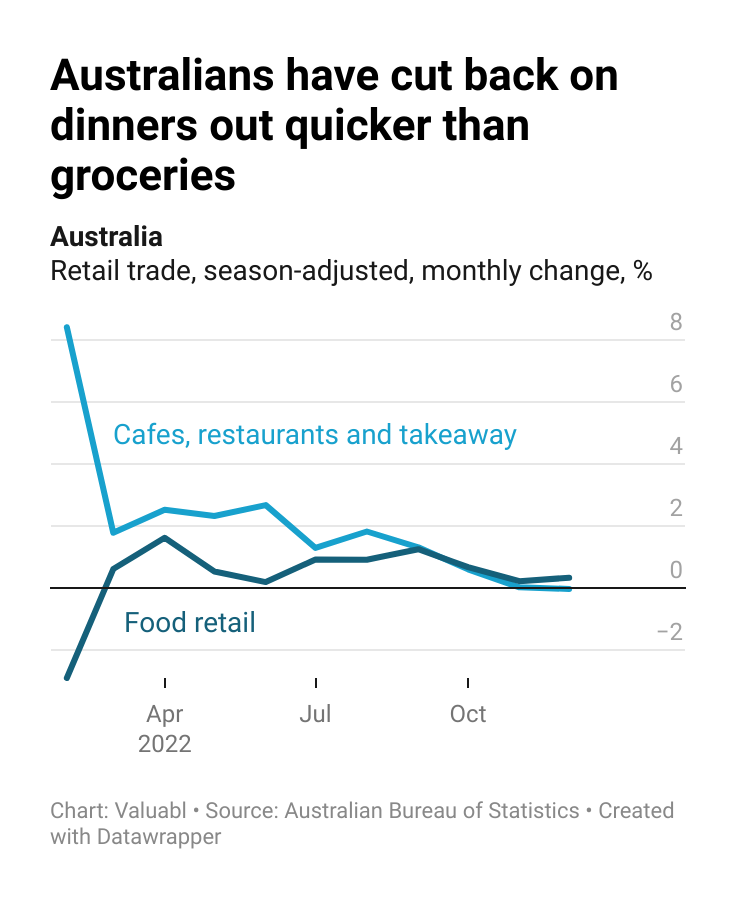
Australia’s January retail sales numbers released on February 28th: As shoppers turn away from restaurants and cafes and get their food from supermarkets, Metcash's top and bottom lines will pop. Rising costs and stretched household budgets have hit dining out and takeaway sales. Households have been cutting back on dining out faster than on groceries. And economists expect this trend to continue.
Earnings release on March 7th: Inclement weather in Australia could boost the firm's top and bottom lines. The price of fruits and vegetables has risen because farmers haven't produced enough this summer because of unseasonable wetness. Higher than-expected prices have made eating out much more expensive. Suppose more diners decide to cook at home than economists expect. In that case, this could prove to be a more considerable boost than analysts expect—they've already baked revenues to be 6% higher than last year into their forecasts.
New boss of the food business announced by June: The announcement of the food division's new boss will draw attention to the company and could make investors re-evaluate the stock. The current EV/EBIT multiple is 10x, while the industry median is 12x. Scott Marshall, the current head of Metcash's food segment, resigned last month, and the board expect they'll replace him by the end of June.
Key risks
Australian household deleveraging: A home repairs and upgrades downturn would hit the firm's hardware business, directly impacting a fifth of the company's sales. Australian households are enormously indebted. They owe A$2.6trn, or 117% of GDP, the second highest debt ratio of any country in the world. Interest rate rises have already put pressure on household budgets, making families less likely to borrow and spend, especially on significant home repairs or upgrades.
A price war over market share: If the firm slashes prices to take market share without cutting costs or improving efficiency, the firm's profit margins will shrink. One of the firm's plans is to take market share from the big three supermarkets and overtake Aldi for number three. According to Statista, a market research firm, Woolworths has 37% of the market, Coles has 28%, Aldi has 11%, IGA has 7%, and all other grocers have a combined 17%. As margins are the key driver of the enterprise's value (+0.7 correlation from Monte Carlo simulation), if the firm has to cut prices to gain market share but can't cut costs, it will hurt value.
Immigration: If fewer people move to Australia than economists expect, economic growth and consumer spending will falter, and Metcash's sales growth will slow. The crucial part of Australia's growth prospects is immigration, as the birth rate is low and declining. If border closures and restrictions put new immigrants off moving to Australia, the population won't grow as quickly.
II) Numbers
Key drivers
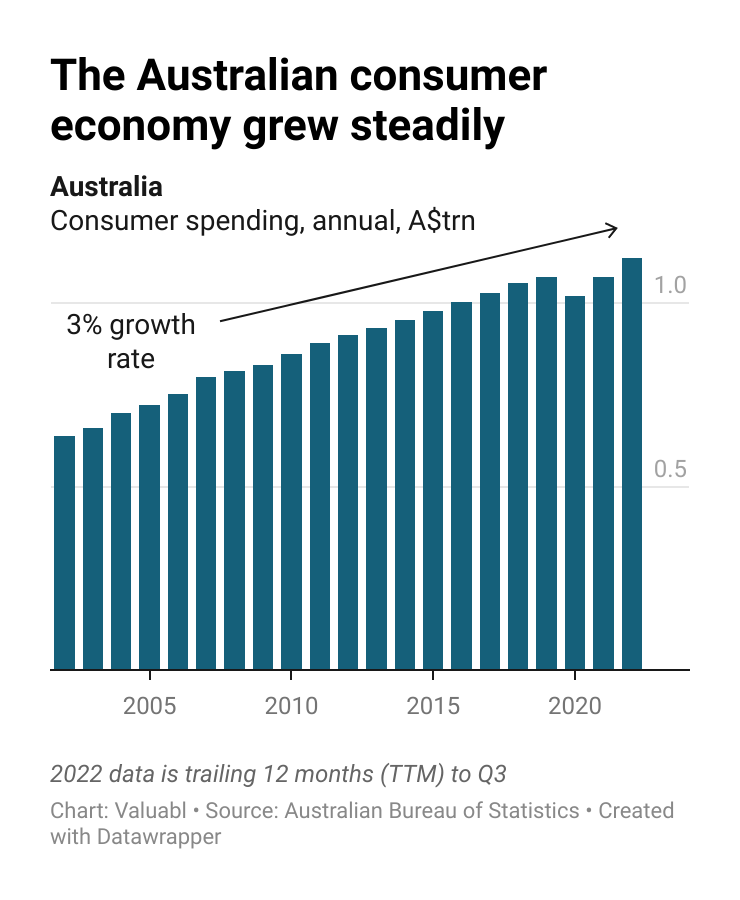
Australia's consumer economy is expanding slowly and steadily
Metcash capitalised on Australia's thriving retail industry, buoyed by growing consumer spending. With disposable incomes rising, shoppers spent more than A$1.1trn last year, up from A$638bn in 2002—this contributed to the 6% per year average GDP growth rate since then. Although consumer spending took a hit during the pandemic-induced lockdowns in 2020, it has since rebounded.
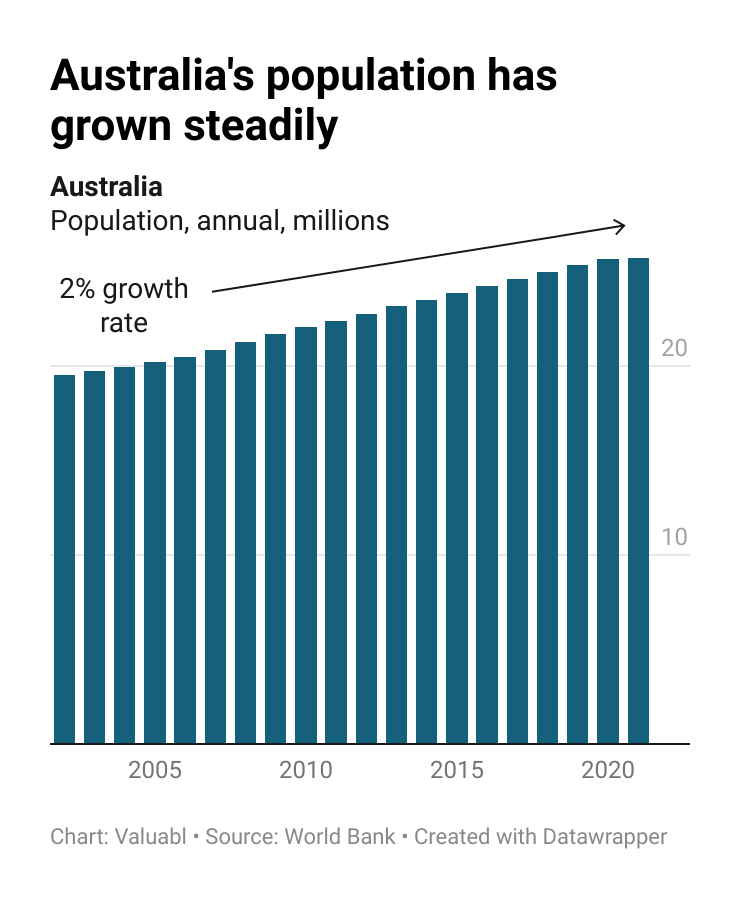
Because the population is increasing
Australia's steady population growth has been a critical driver for the retail industry. According to data from the Australian Bureau of Statistics, the country's population grew at an average rate of 2% per year, fueling demand for food, booze, and other consumer goods.
But the recent pandemic-induced border closures have hurt population growth, with just 33,000 new people, or 0.1% growth, in 2021. This slower growth rate is likely to continue, with the government's statistical forecaster predicting a population of 30m by 2033, a 1% per year growth rate.
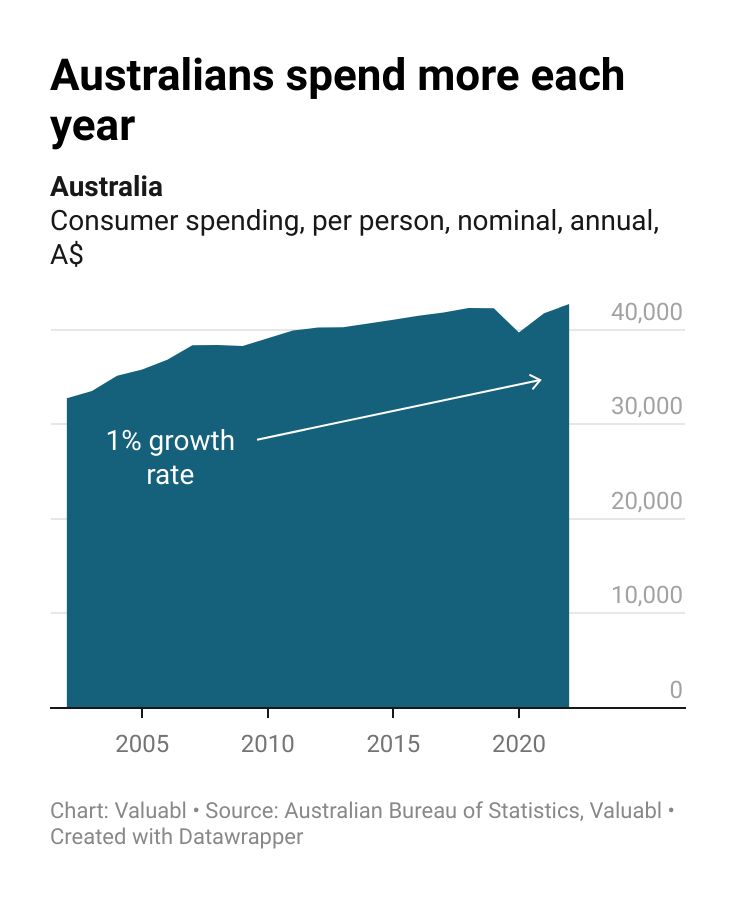
And Aussies are spending more each year
Australia's steady rise in GDP per person has increased consumer spending. From 2002 to 2021, GDP per person grew at an annual rate of 4% to A$85,000. This rise in disposable income has increased per-person consumer spending, which grew at 1% per year from A$32,700 in 2002 to A$42,700 last year. The long-term trend is up despite shoppers spending less in 2020 due to covid lockdowns.
Revenue growth
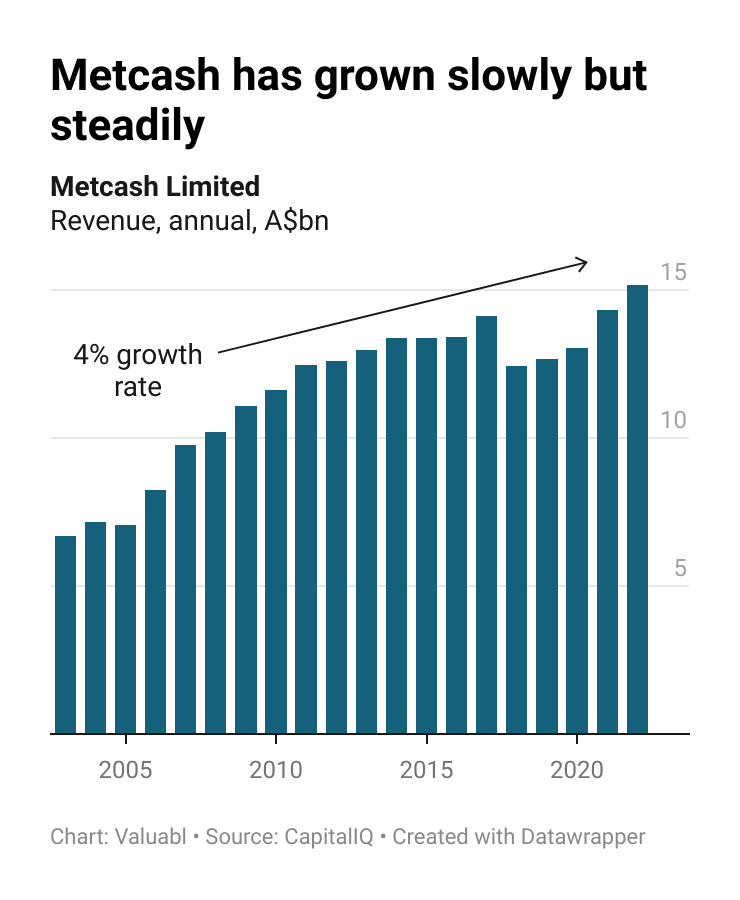
A mature firm, growing slowly by acquisition
Metcash's top-line growth has been slow and steady, reflecting consumer spending trends. The company more than doubled its revenue from A$7bn in 2003 to A$15bn last year at a 4% per year growth rate. The company achieved this growth through strategic acquisitions, buying other retailers to complement its portfolio, such as Franklins, Mitre 10, and Home Timber and Hardware. In 2020, they raised A$330m to acquire three more businesses, including 70% of Total Tools, the franchisor of Australia's most extensive tool retail network, for A$57m.
In the past three years, Metcash's revenue growth accelerated to 7% per year, slightly outpacing the peer set of 324 global food and staples retailers with a median rate of 6%. A liquor, home improvement, and home-cooking surge spurred by the covid19 pandemic drove this uptick in growth.
Margins
Low prices and low margins
Metcash's profit margins are low yet stable, averaging just below 3%. While these margins are slightly below average for the industry, the retailing and wholesaling sector is a competitive, low-margin industry with no pricing power. Scale and efficiency are crucial. Although the company's margins took a hit after moving into the hardware business, they have recovered in recent years. Competing on price and range is vital as the distribution of profit margins is tight. Median net operating margins for the sector are 4%, with half of the companies earning between 2-5%.

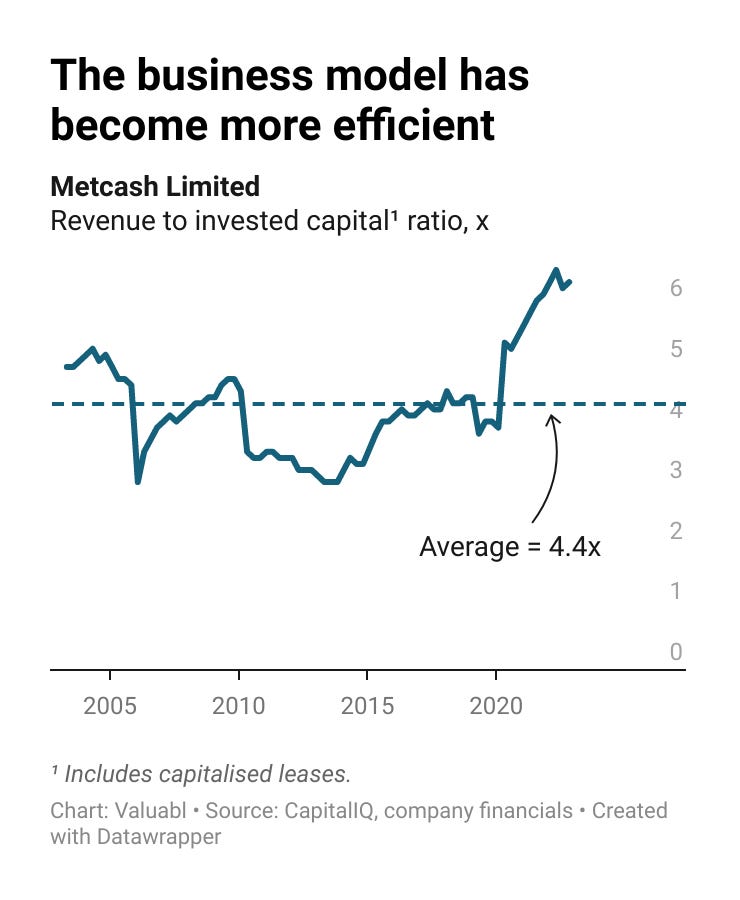
Capital intensity
Huge volumes supported by an efficient business model with economies of scale
Metcash's capital intensity is notably low, thanks to its efficient business model and economies of scale that support huge sales volumes. The company generates more than A$4 of net sales for every dollar of capital invested in operating assets. That ratio is higher than the 3x ratio for the median company in the peer set.
However, the pandemic-induced spike in demand for groceries, liquor, and homewares resulted in a temporary increase in the company's ratio to 6x. Metcash's efficient inventory management and excellent operational capabilities allowed the firm to meet the spike in demand with minimal additional fixed investments in shop space and warehousing. And as the company has been so acquisitive, goodwill from acquisitions accounts for 23% of invested capital, compared to the industry average of 11%.
ROIC decomposition and competitive analysis
The firm creates economic value but has to watch its margins
Metcash's return on invested capital (ROIC), which averaged 11% over the past three years, higher than its cost of capital, shows its ability to generate economic value through its operations. With a high sales-to-invested capital ratio, small changes in margins have a significant impact on the firm's returns. Despite the intense price competition in the industry, Metcash's prolific volumes help produce an after-tax ROIC in line with other retailers and wholesalers. Just a third of firms have a higher return on capital.
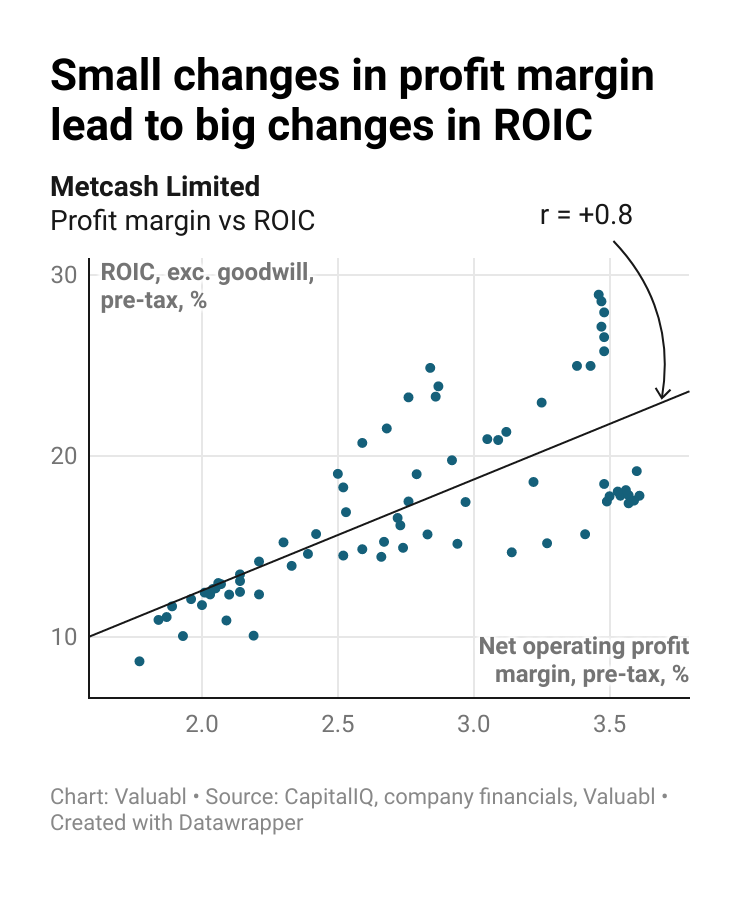
The firm’s competitive advantage is its size and scale. With the most extensive retail distribution network in Australia, the firm can service more shops per warehouse, resulting in a higher asset turnover ratio.
III) Valuation and sensitivity analysis
Metcash, the Australian wholesale and distribution company, will cut prices and buy other companies to try and get more of the retail market. With the population and consumer spending projected to grow by 1% per year, the firm is poised for 2% top-line growth. However, this growth will come at a cost, as price cuts and higher costs will take a bite out of the margins. They will decline to their long-term average of 2.7%. Capital efficiency gains from pandemic-induced shopping will subside, and the firm will invest in e-commerce, supply chain optimisation and acquisitions. Nevertheless, with positive free cash flows and no need to raise capital, Metcash remains a well-positioned retailer with modest debt, operational scale, and a strong credit rating.
Growth: I forecast Metcash’s top line to grow at 2% for the next five years. Economists expect the population to grow by 1% per year and for consumer spending to grow at the same pace. More people who spend more will drive this growth. The firm will cut prices to take market share from Woolworths, Coles and Aldi. That will work but stifle sales growth.
Margins: I expect the firm’s margins to decline towards their long-term average of 2.7%. Price cuts and rising costs will weigh on profitability, but investments in e-commerce and supply chain optimisation will help. The business’s economies of scale will stop margins from dropping too far in the case of a price war, but the hyper-competitiveness of the industry will prevent them from expanding much.
Reinvestment and taxes: I model the pandemic efficiency gains the firm enjoyed to disappear. As the firm reinvests in e-commerce, supply chain optimisation, and buying other companies, it will get A$4.40 in new net sales for every dollar invested in growth. I also model the firm’s tax rate to converge on the underlying marginal tax rate across Australia and New Zealand.
Cost of capital: I estimate the firm’s weighted-average cost of capital (WACC) is 4.8%. Metcash is a scaled food, staples and speciality retailer in Australia and New Zealand with modest debt and strong credit.
Intrinsic value: A$4.70–7.50
Upside: +48%
Implied IRR: 8%
Sensitivity analysis and rating
Monte Carlo Simulation is used to model uncertainty by assuming that the inputs to the valuation model will come from probability distributions around the estimates.
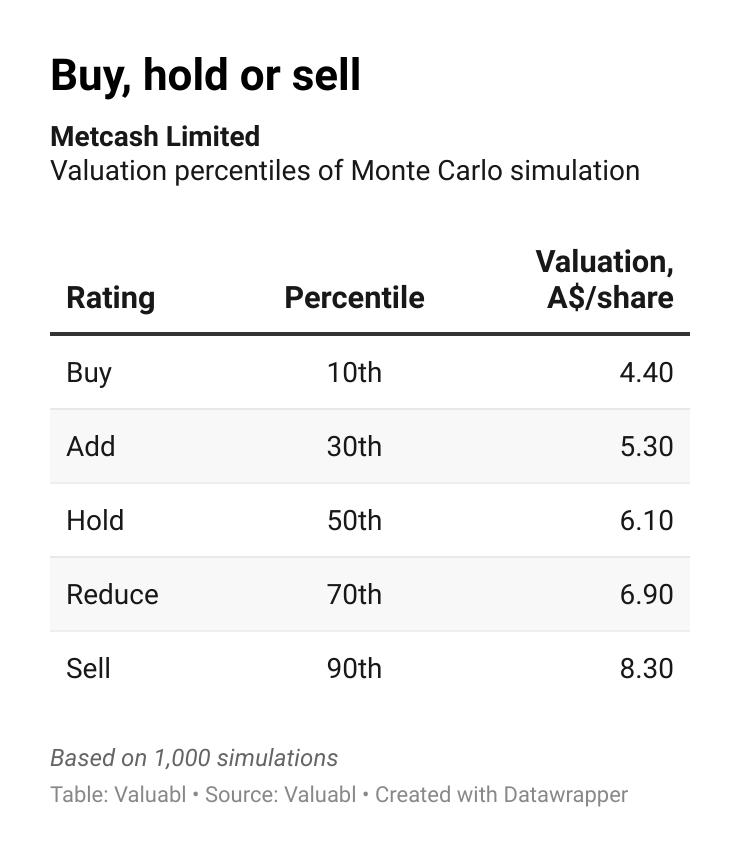
Metcash’s share price is at the fifth percentile on the Monte Carlo distribution and, as a result, has a Buy rating. The shares are uncorrelated enough with what I own for me to start buying.
Please, no copying
If you are a reader of Valuabl, you ought to be a subscriber to Valuabl.
Please don’t
Print or screenshot multiple copies from your computer or phone for others.
Copy and post Valuabl, in whole or in part, on your company’s intranet, a website, or anywhere on the internet.
Please do
Show others your copy of Valuabl in person.
Form a group to receive special subscription rates.
Ask for free trials for friends, colleagues, and loved ones (I’m happy to oblige you).
Do the right and lawful thing. Subscribe. Questions? Reply to any email from Valuabl or email valuabl@substack.com
Disclaimer
Copyright © 2023 by Valuabl. Reproduction or retransmission in any form without permission is prohibited. This publication should not be considered financial or legal advice but instead independent research.