Vol. 3, No. 5 — Slaying the stimulus scare-bug
Supply chains, not government spending, caused inflation. Stock valuations have thrashed back and forth. Bond traders might be wrong about a recession. Value in African telecommunications.
Welcome to Valuabl, a twice-monthly digital newsletter providing value-oriented financial market analysis and investment ideas. Learn more
Housekeeping
In last fortnight's issue (Vol. 3, No. 4, Interest rate holes in the hull), I wrote that quantitative easing is when the central bank sells bonds. I should have written quantitative tightening. Sorry.
In today’s issue
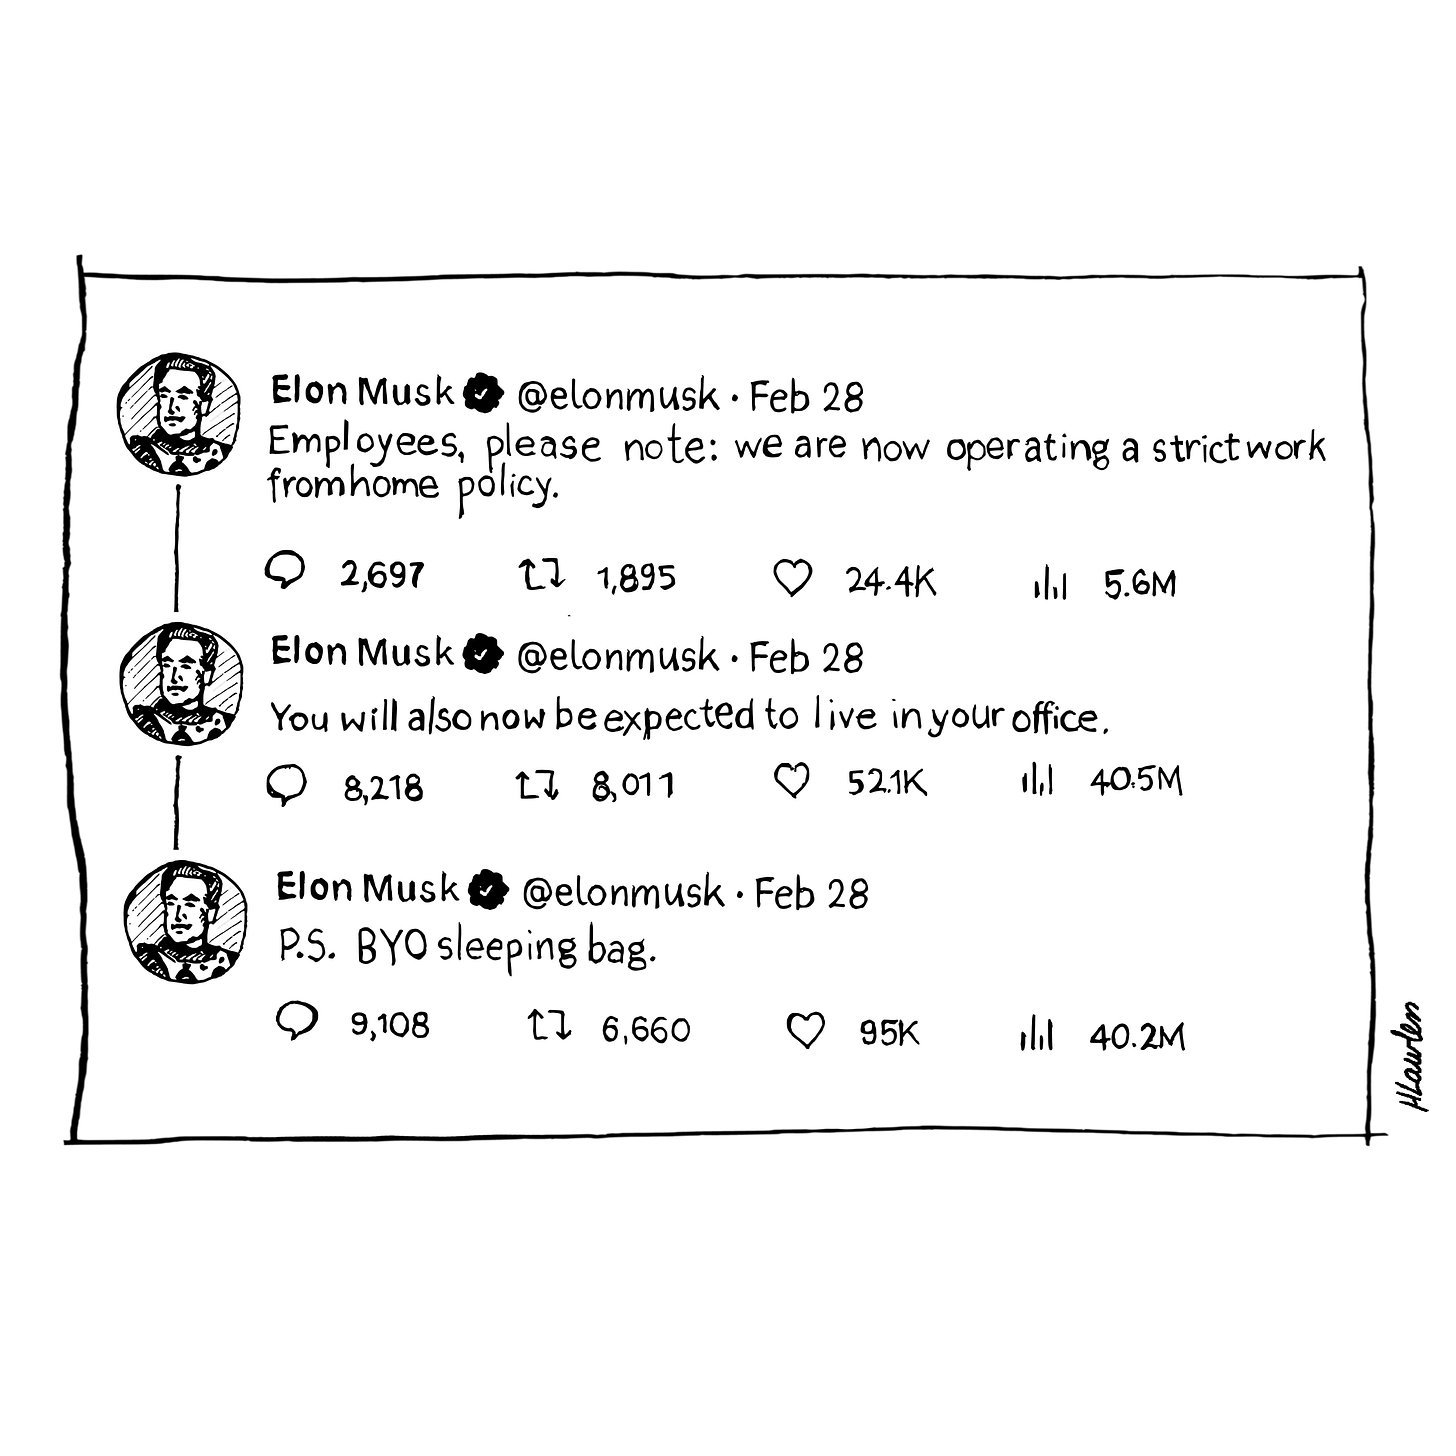
Cartoon: WFH WTF!?
Slaying the stimulus scare-bug (4 minutes)
Cost of capital (3 minutes)
Global stocktake (3 minutes)
Rank and file (1 minute)
Credit creation, cause and effects (6 minutes)
Debt cycle monitor (1 minute)
Investment idea (17 minutes)
"There is no financial reason for the government to ever default on debt denominated in its own currency." — Warren Mosler
Cartoon: WFH WTF!?
Slaying the stimulus scare-bug
Supply chains, not government spending, caused inflation.
•••
As the pandemic raged, governments had to find ways to keep their economies afloat. Lockdowns meant businesses would collapse as they didn't have customers, supplies, or workers. That is unless they got support. Countries had to spend big to support companies and households or face calamity.
But some economists and pundits opine that this stimulus caused inflation. They argue that more spending meant higher prices. They're wrong. Lockdowns and supply chain problems, not deficits, made prices rise. And treating a supply-side problem with a demand-side solution won't work.
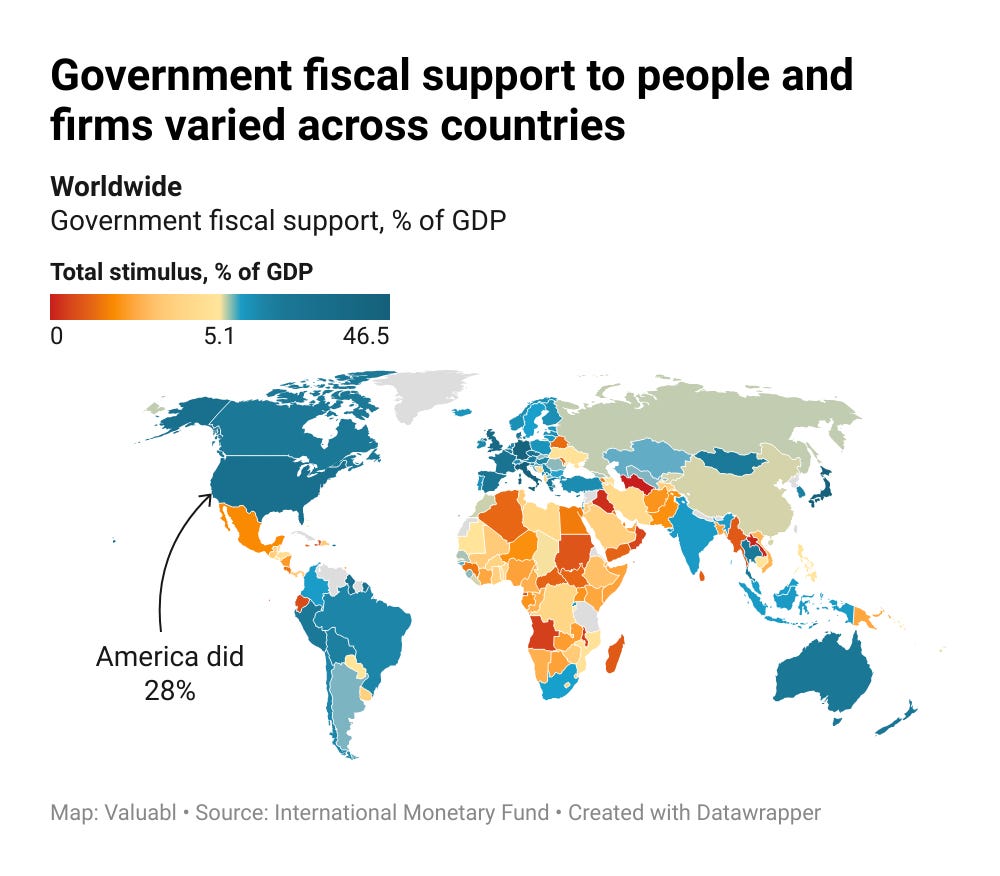
According to International Monetary Fund data, countries targeted different types and levels of stimulus. Some countries focused on spending more and taxing less. Others supported liquidity with loans, guarantees and asset purchases. Combining those shows that rich countries did more stimulus as a percentage of GDP than poor ones. America, for example, spent an extra 28% of its GDP to support individuals and firms. Germany spent 43%. While Pakistan and Zambia only spent 2%.
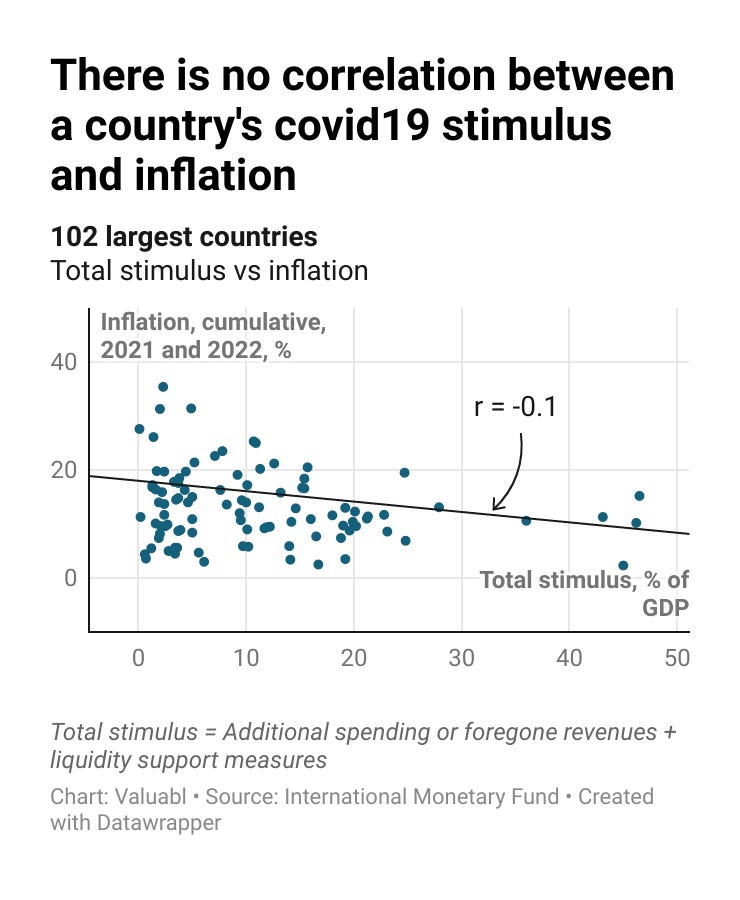
If stimulus had caused inflation, the more a country spent, the higher its inflation would be. There should be a correlation. But, plotting each country's stimulus against inflation reveals no relationship. The result is the same regardless of whether you use 2021 or 2022's inflation data.
This dot plot may hide causality and omit other variables that cause both outcomes. But as the stimulus was discretionary, it measures the government's spending policies. Further, although this analysis is simple, it would be hard to argue a link between the two in the face of this.
So why is there no connection here? The answer lies in understanding the nature of inflation.
There are two types of inflation: demand-pull and cost-push. The first occurs when there is too much money—the government spends more than the economy's productive capacity can handle. While cost-push inflation happens when production costs rise, leading to price increases.
Cost-push inflation caused the recent price hikes we see. The pandemic disrupted global supply chains, which led to shortages and higher costs. That, in turn, drove prices up. Stimulus measures, like job-retention payments, supported spending. But they didn't cause the price jumps. During lockdowns, the global economy was underutilising labour and productive resources. That meant there was productive capacity waiting to come online when lockdowns finished.
Lawmakers are tackling the wrong problem. They want to hit demand by targeting a higher interest rate. But demand wasn't the problem. Supply was. Higher interest rates and less money don't create barrels of oil.
But the good news is that cost-push inflation is temporary. It tends to self-correct. Higher prices drive higher profits and more investment. This supply increase has already happened in some sectors like energy and materials. Prices there have come down as supply chains have expanded and stabilised.
By slaying the stimulus scare-bug, regulators put themselves in a better position to fix future inflation. We have the money to support the vulnerable without making prices spiral. But the longer we stick our heads in the sand, the worse.
"It's hard to beat the system when we're standing at a distance. So we keep waiting, waiting on the world to change." — John Mayer
Cost of capital
Finance’s most important yet misunderstood price is capital. Here’s what happened to the cost of money in the past fortnight.
•••
Stock prices fell last fortnight. The S&P 500, an index of big American companies, dropped 4% to 3,970. The market continues to rise from its October lows but is still 8% below where it was last year.
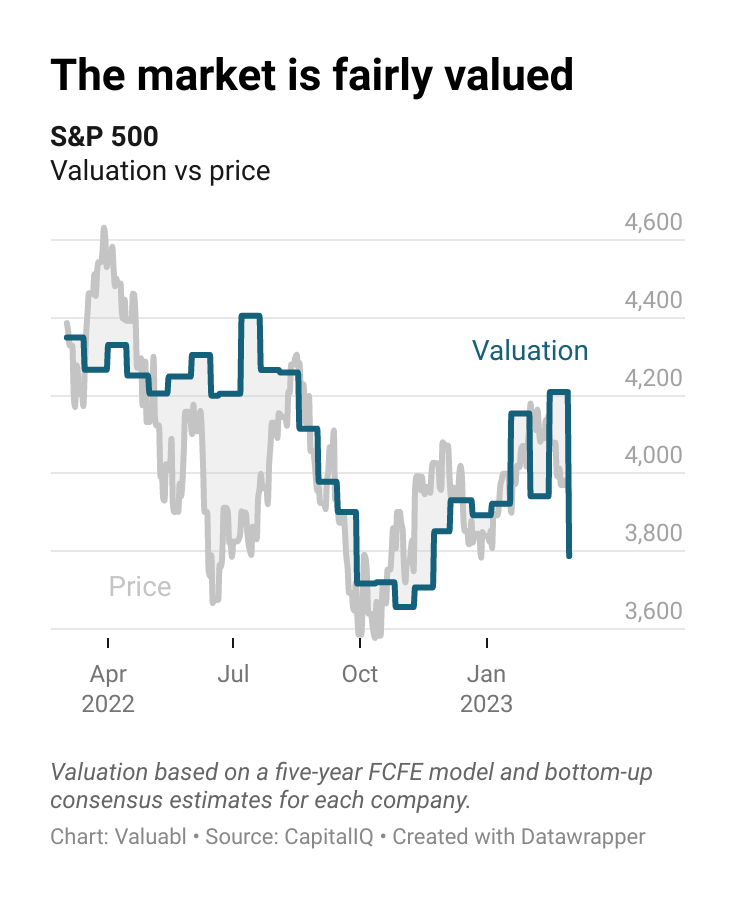
I value the S&P 500 at 3,788, which suggests it is fair value. My valuation has thrashed back and forth in recent months. Significant movements in bond yields and consensus estimates are to blame. Traders and analysts are uncertain about the future, which has shown up in estimates.
The companies in the index earned $1,627bn in the past year, down $31bn from last fortnight. They paid out $506bn in dividends, bought back $986bn worth of shares, and issued $71bn of equity.
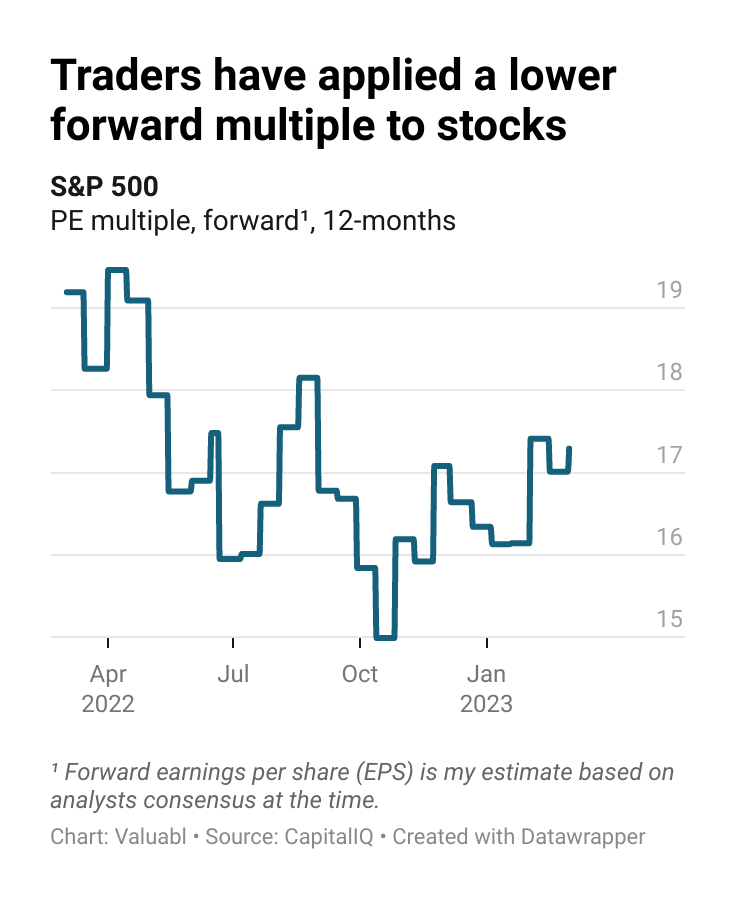
The forward price-earnings (PE) ratio rose to 17.3x. My 12-month forward earnings per share (EPS) estimate for the index dropped from 244 to 229.
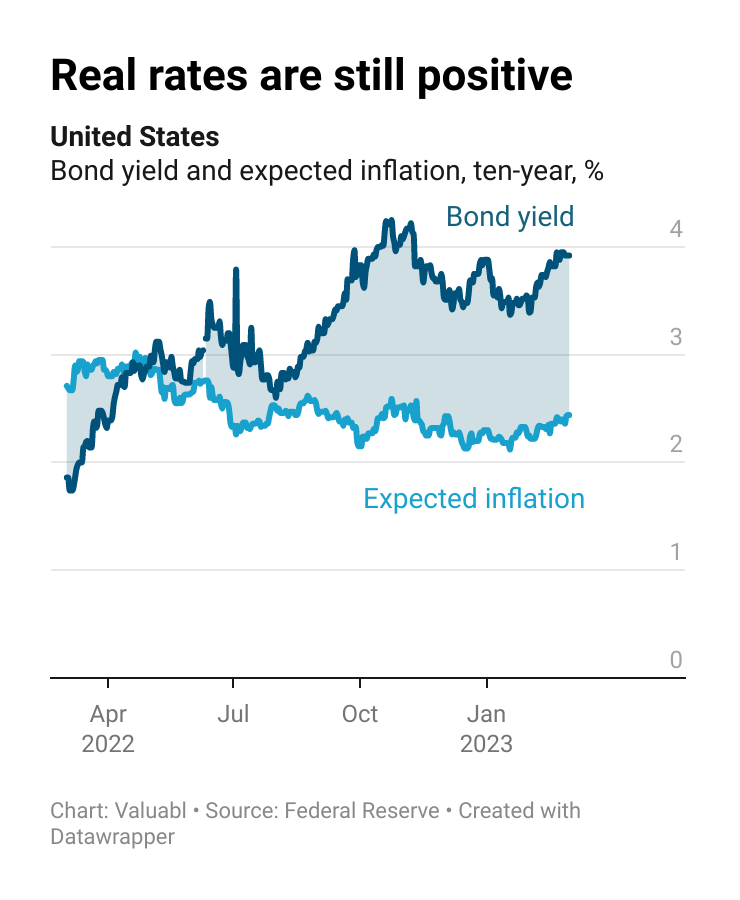
Government bond prices dropped. Yields, which move the opposite way to prices, rose with inflation expectations. The ten-year Treasury yield, a critical financial variable, climbed 11 basis points (bp) to 3.9%. Investors expect inflation to average 2.4% over the next decade. That's 9bp higher than the rate they expected last fortnight.
The real interest rate, the gap between yields and expected inflation, increased by 2bp to 1.5%. These inflation-adjusted rates are up over two percentage points in the past year.
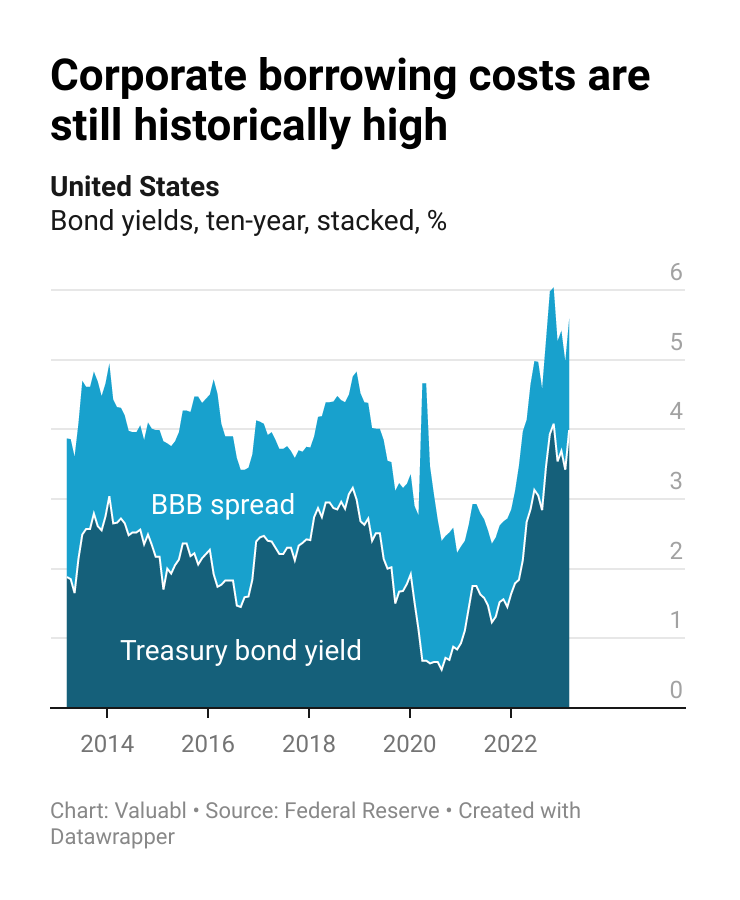
Corporate bond prices also went down. Credit spreads, the extra return creditors demand to lend to a company instead of the government, rose by 6bp to 1.6%. The cost of debt, the annual return lenders expect when lending to these companies, jumped 17bp to 5.5%.
Refinancing costs have almost doubled, up 2.2 percentage points, in the past year. But they’ve been declining since they peaked in October above 6%.
The equity risk premium (ERP), the extra return investors want to buy stocks instead of bonds, fell 29bp to 4.9%. It’s now about the same as it was a year ago. The cost of equity, the total annual return these investors expect, also fell 18bp to 8.8%. These expected returns are a little above their long-term average.
Global stocktake
Valuing regional and global stock markets to help us find the best ponds in which to fish for value.
•••


